Creating your first custom view
Go to the Home > Custom Views menu and click the pencil icon located on the far right of the interface to enable editing mode.
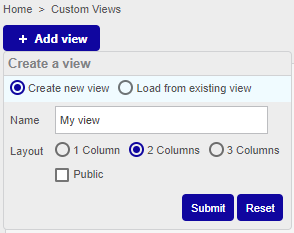
Click + Add view to create your first custom view, then enter My view for the name and select 2 columns. Finally, click Submit:

Add your first widget by clicking + Add widget, then enter TOP 10 CPU for the title and select Live Top 10 CPU Usage. Click Submit:
Click + Add widget, then enter TOP 10 Memory and select Live Top 10 Memory Usage. Click Submit:
The second widget is automatically placed on the second column:

Click + Add widget, then enter Unhandled alerts and select Services Monitoring. Click Submit:
Edit this widget by clicking the wrench icon:

In the popin, uncheck the following items:
- Display Pending
- Display Duration
- Display Tries
Then click Apply.
Click + Add widget, then enter Global Health and select Global Health. Click Submit:
Edit this widget by clicking the wrench icon and then selecting Show services for the Services/Hosts field. Then click Apply:
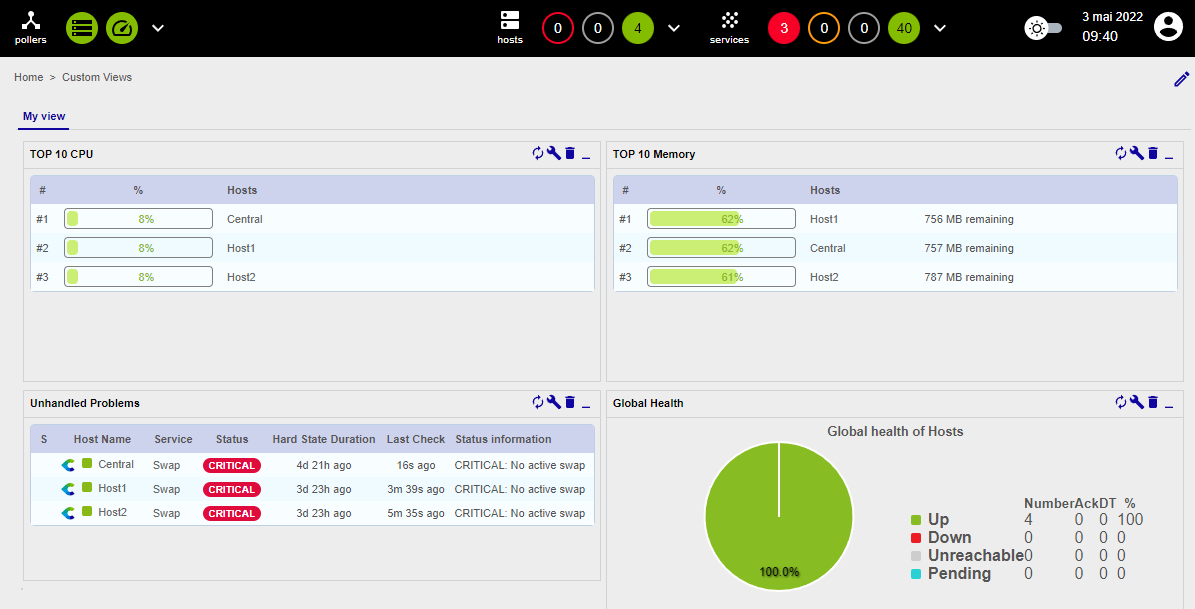
Your first custom view is created:
