Monitor a MySQL or MariaDB database
The objective of this tutorial is to monitor a Mysql/MariaDB database.
Prerequisites
On the database you want to monitor
To be able to collect the necessary information from the database, a database user with specific privileges is required. If the database you want to monitor is a Centreon database, a dedicated user already exists and is called centreon. Otherwise, start by creating a new user: log in to your database, then run the following command:
CREATE USER 'username'@'IP_POLLER' IDENTIFIED BY 'password';
Then, whether your database is a Centreon database or not, run the following command:
GRANT SELECT ON *.* TO 'username'@'IP_POLLER';
Replace the username, the IP address of the poller and the password with the values you want.
In the user interface
The database will be monitored using the MySQL/MariaDB Monitoring Connector. Go to Configuration > Connectors > Monitoring Connectors and install the MySQL/MariaDB Monitoring Connector:
Configure the host and deploy the configuration
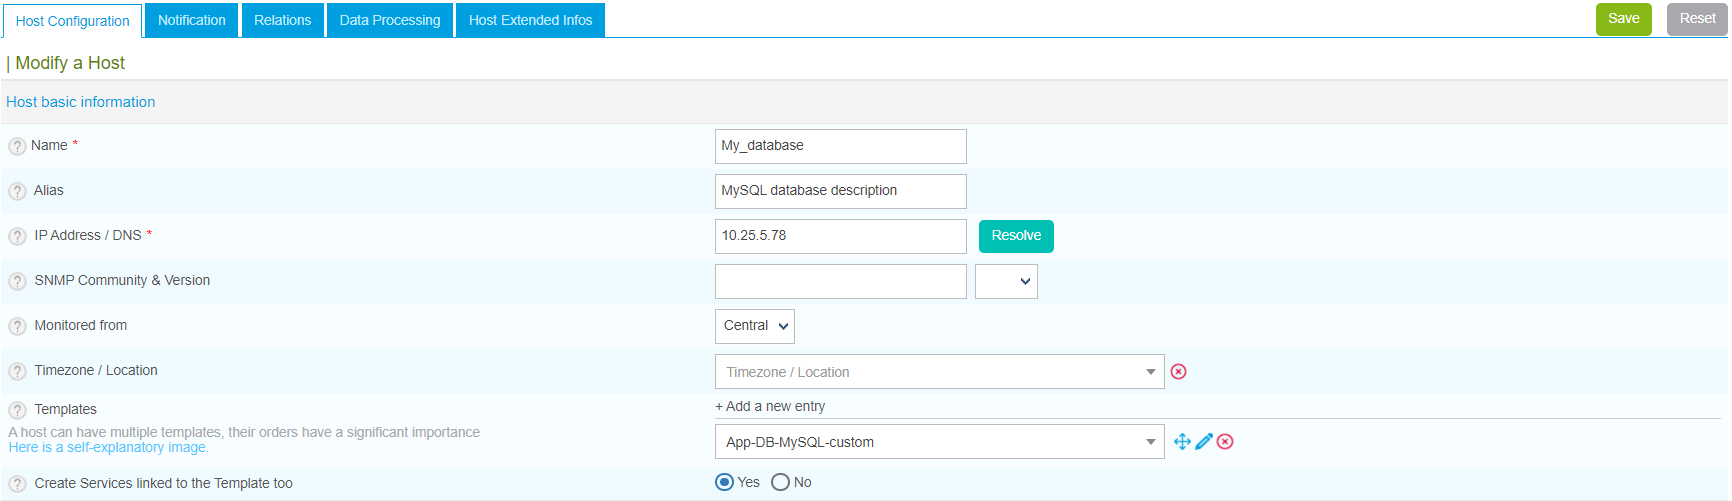
- Go to Configuration > Hosts > Hosts (simplified) and click Add:
- Input the following information:
- The name of your server
- A description of your server
- Its IP address
- Select the poller that will monitor the database
- Click the + Add New Entry button for the Templates field and select the App-DB-MySQL-custom template:
- A list of macros matching the template will appear:
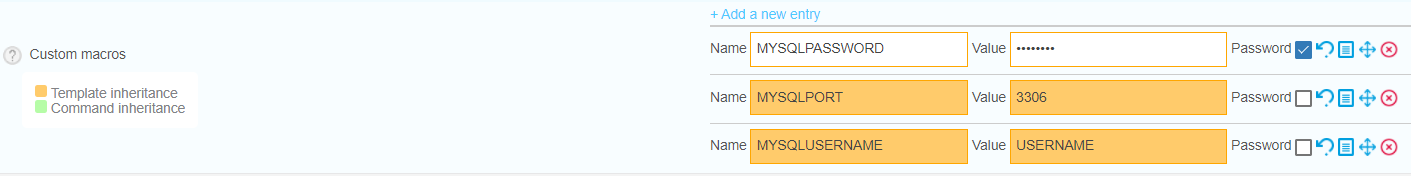
Fill in the value of following macros:
- MYSQLUSERNAME: the name of the user that will connect to the database.
- MySQLPASSWORD: the password associated with this user.
- MySQLPORT: the listening port of the database, by default 3306.
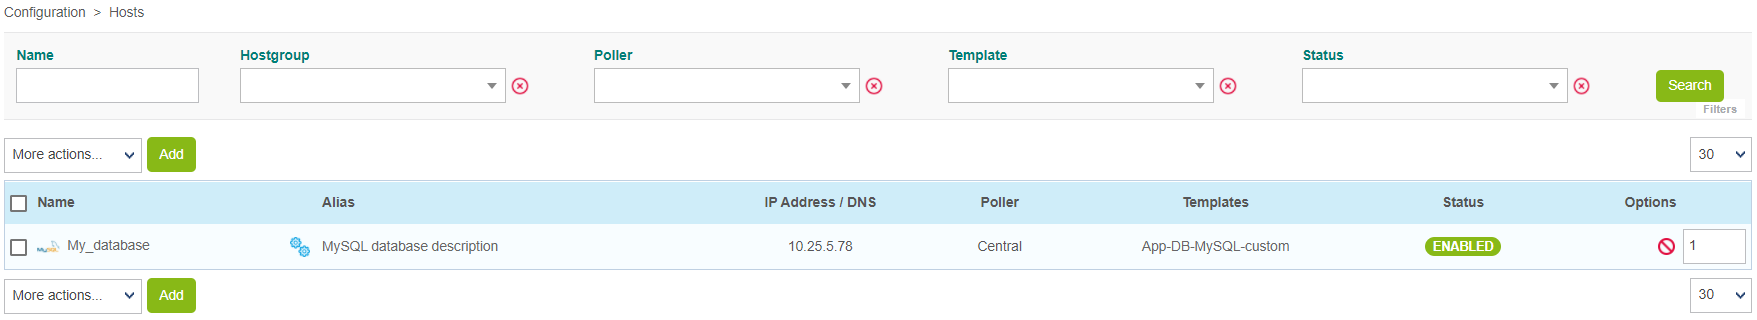
- Click Save. Your device has been added to the list of hosts:
- Go to Configuration > Services > Services (simplified). A set of indicators has been deployed automatically:
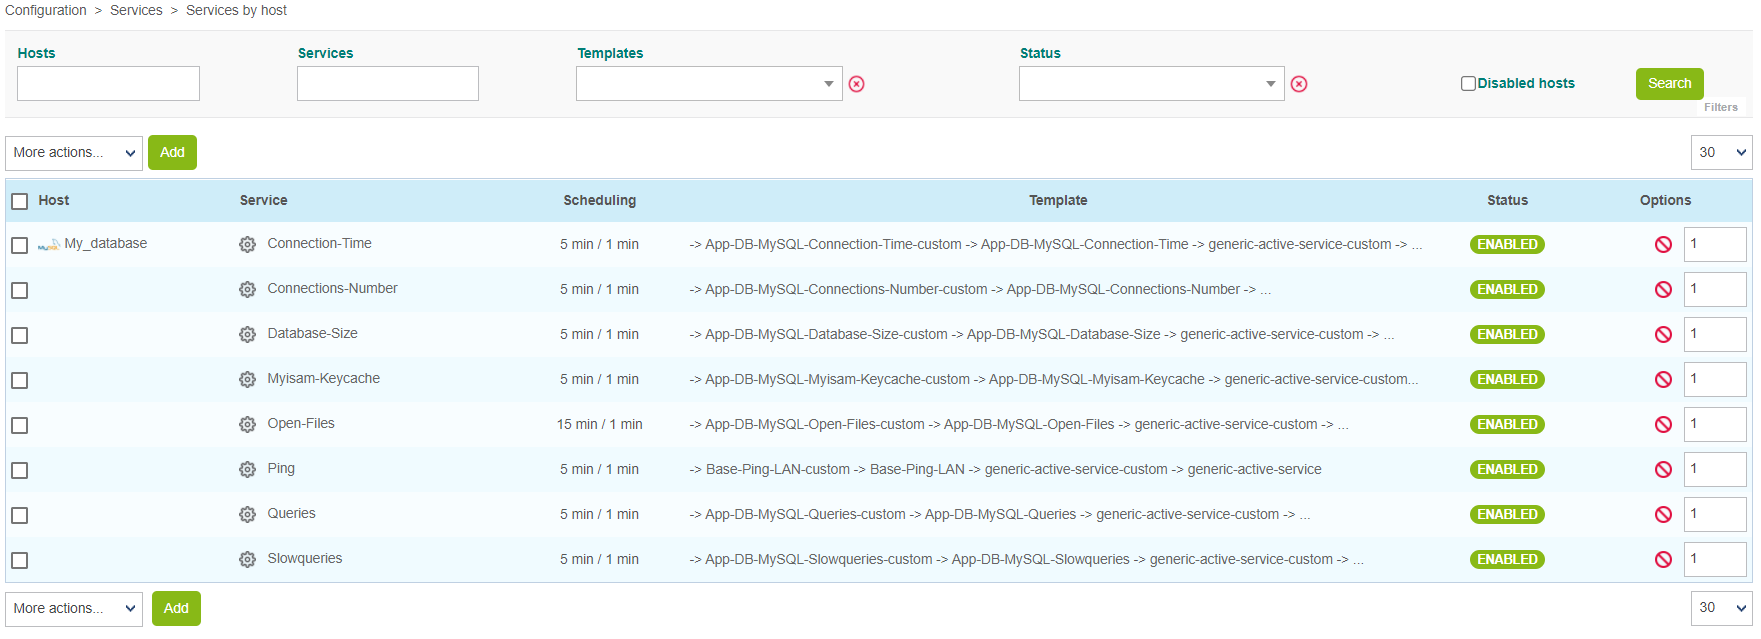
-
Go to Monitoring > Status Details > Services and select All for the Service Status filter. At first, the resources appear with the status Pending, which means that no checks have been executed yet. After a few minutes, the first results of the monitoring appear: