Monitor Business Activities
After adding, editing or deleting the BAs, KPIs and BVs, the objects linked to Centreon BAM, go to Configuration > Poller and deploy the configuration.
After you have loaded the configuration and checked the services linked to the
KPIs, the BA will be up to date and available under
Monitoring > Business Activity > Monitoring.
Interpret real-time data
Main page
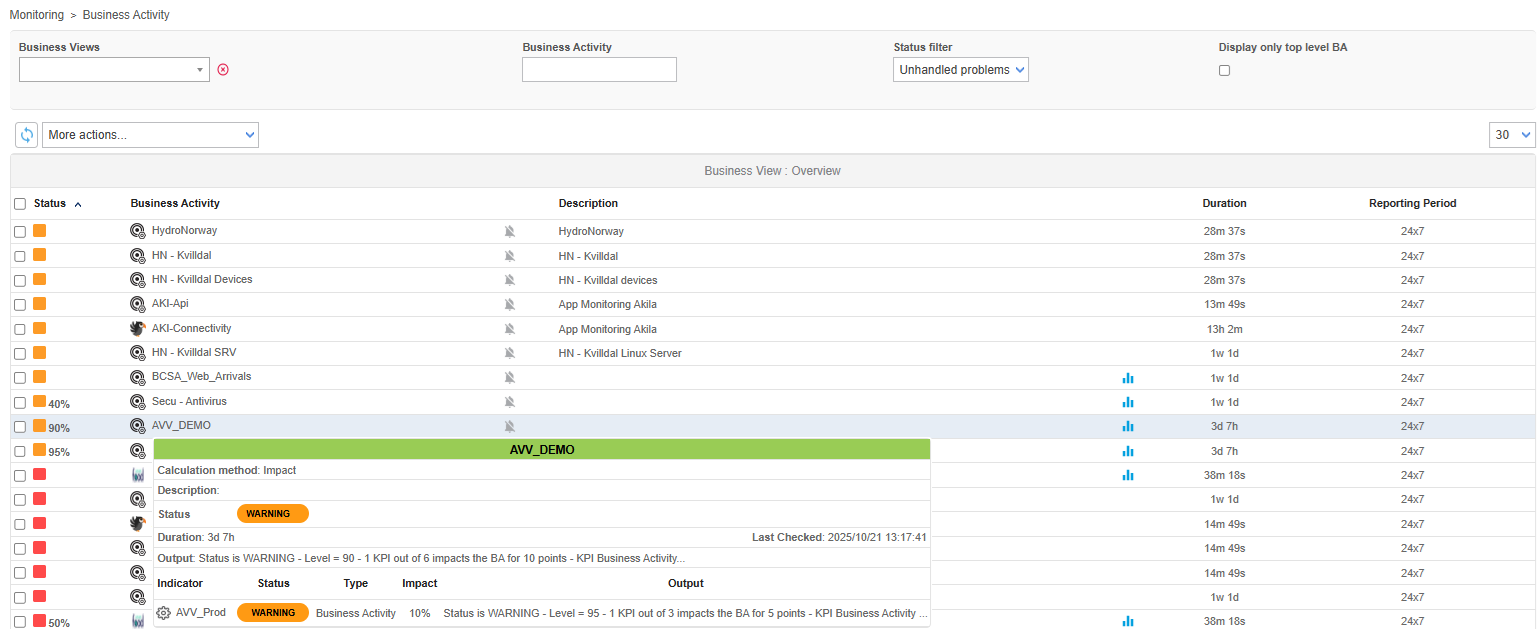
A table on the main page lists all the essential information concerning the live status and health level of the BAs.
Non-admin users can only see the BAs associated with BVs linked to their access group:

| Column | Description |
|---|---|
| Current Level | Current level in % |
| Business Activity | Name of the BA |
| Description | Description of the BA |
| Duration | Duration of the current status |
| Reporting Period | Default reporting period used for that BA |
You can view the evolution of BA health level by hovering your mouse over the name or description of the BA, and a pop-up appears displaying all the KPIs and status information.

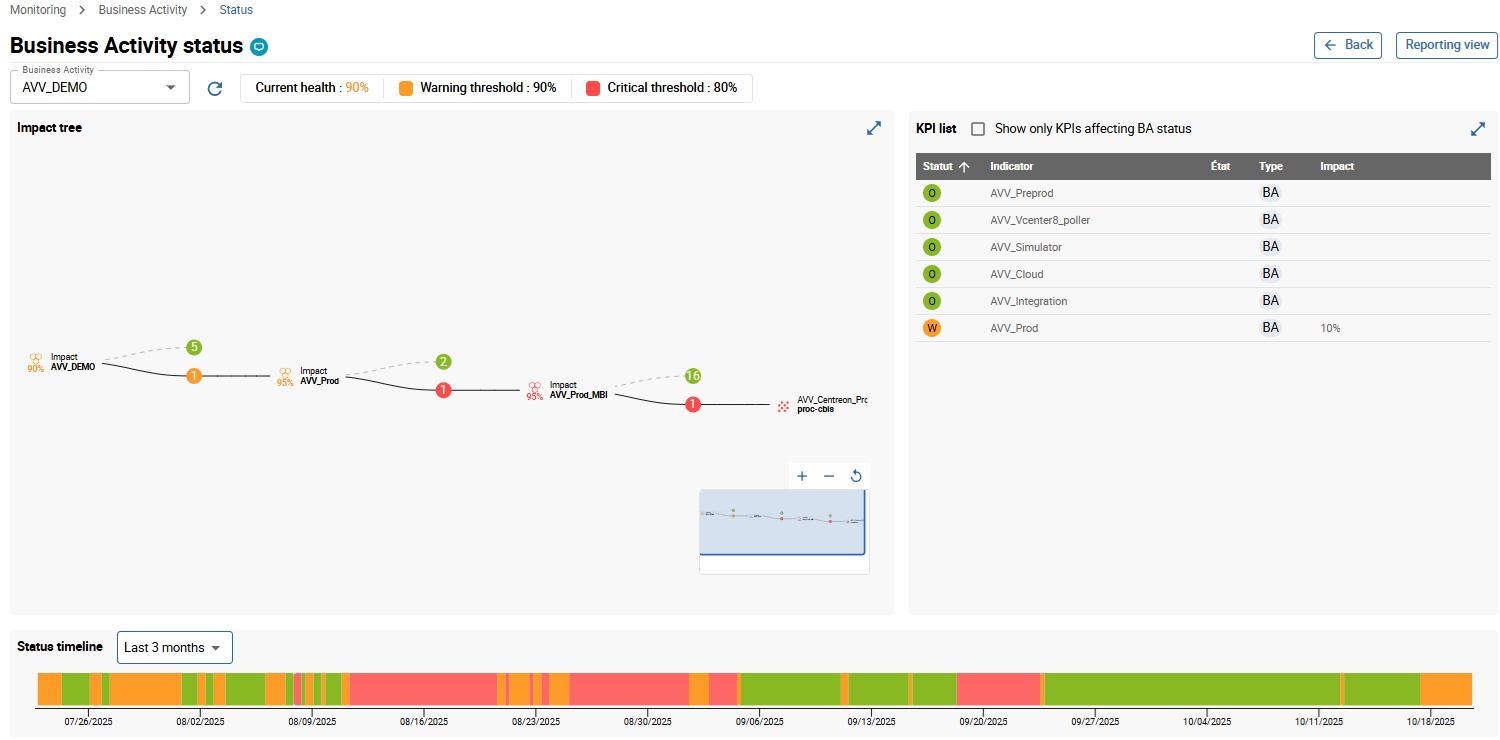
Click the name of the BA to bring up a detailed live view.
Detailed View
The detailed view is divided into six parts:

- Business Activity dropdown list to change the BA.
- Status information on the BA Current health level and alert thresholds.
- Reporting view button to access the reporting page.
- Area containing the BA Impact tree. You can open a sublevel, zoom in and out and move the tree.
- Table containing the KPI list impacting the BA level.
- The Status timeline bar displaying a timeline of statuses.