Event consoles
Some of these interfaces are deprecated and replaced by the Resources Status page. This new page aims to regroup all the experiences you can find in these interfaces.
Deprecated pages will be removed in the next major version of Centreon.
For new installations, deprecated pages are automatically hidden. It is possible to display them by selecting the option Use deprecated pages in the preferences specific to each user from the menu Administration > Parameters > My Account.
All links in Centreon will point to these pages: deprecated pages will become your main tool to view the state of hosts and services. However, if you enable this option, you will not benefit from the new features offered by the Resources Status page, such as a more powerful search feature, the ability to customize and share views or to save filters, and any other future enhancements.
This chapter presents the different interfaces used to view the status of resources.
Generic actions
By default, during viewing of statuses of hosts or services, the monitoring data is refreshed automatically (15 seconds by default). Nevertheless, several icons can be used to check the refreshing of the data. The table below summarizes the functions of these icons:
| Icon | Description |
|---|---|
| Used to refresh the results manually. | |
| Pauses automatic data refreshing. | |
| Restarts automatic data refreshing. |
Hosts (deprecated)
This interface is deprecated and replaced by the
Resources Statuspage and the events list.
To view the status of hosts, go into the Monitoring > Status Details > Hosts menu
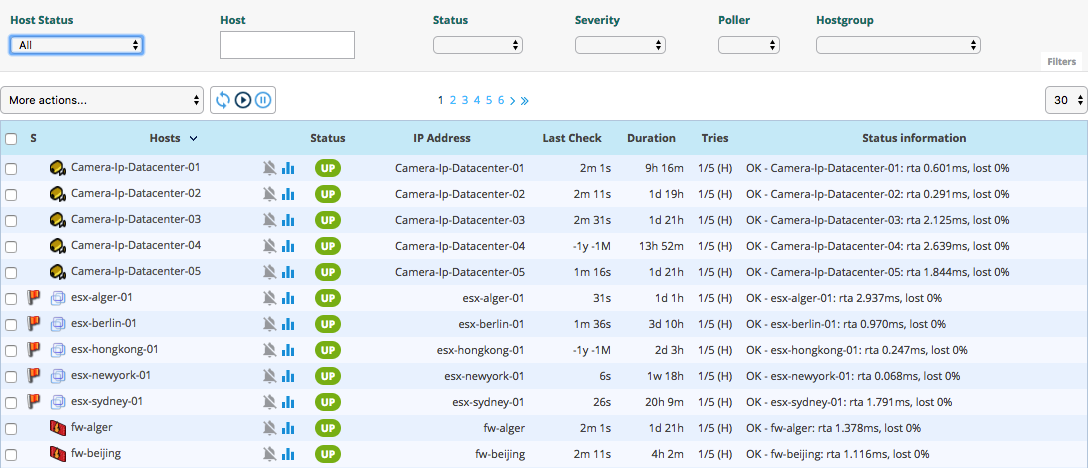
Columns description
- S: Displays the severity level of the host
- Hosts: Displays the name of the host
- The following icon indicates that the notifications for this
host are disabled:

- The following icon can be used to view all the performance
graphs for this host:

- The following icon allows access to a predefined URL
configured:

- The following icon indicates that the notifications for this
host are disabled:
- Status: Used to view the status of the host
- IP Address: Indicates the IP address of the host
- Last Check: Displays the date and the time of the last check
- Duration: Displays the time that the host a has kept its current status
- Hard State Duration: Displays the time that the host a has kept its current hard state (does not appear when viewing all the hosts)
- Tries: Displays the number of tries before confirming the state
- Status information: Displays the message explaining the status of the host
The severity column and the associated filter appear if at least one object displayed has a severity level.
Available filters
You can filter the result presented via the following filters:
- Host Status:
- To view the hosts with a problem but not acknowledged or not in downtime, choose Unhandled Problems.
- To view all the hosts with a problem, choose Host Problems.
- To view all the hosts, choose All.
- Host: Can be used to filter by name of host via an SQL LIKE type search.
- Status: Can be used to filter by the status of hosts.
- Severity: Can be used to filter by severity.
- Poller: Can be used to filter the hosts by poller. Only the hosts of the selected poller will be displayed.
- Hostgroup: Can be used to filter by host group. Only the hosts of the selected host group will be displayed.
The search on text fields only starts after entry of at least 3 characters.
Host groups
To view the status of host groups, go into the Monitoring > Status Details > Hostgroups Summary menu
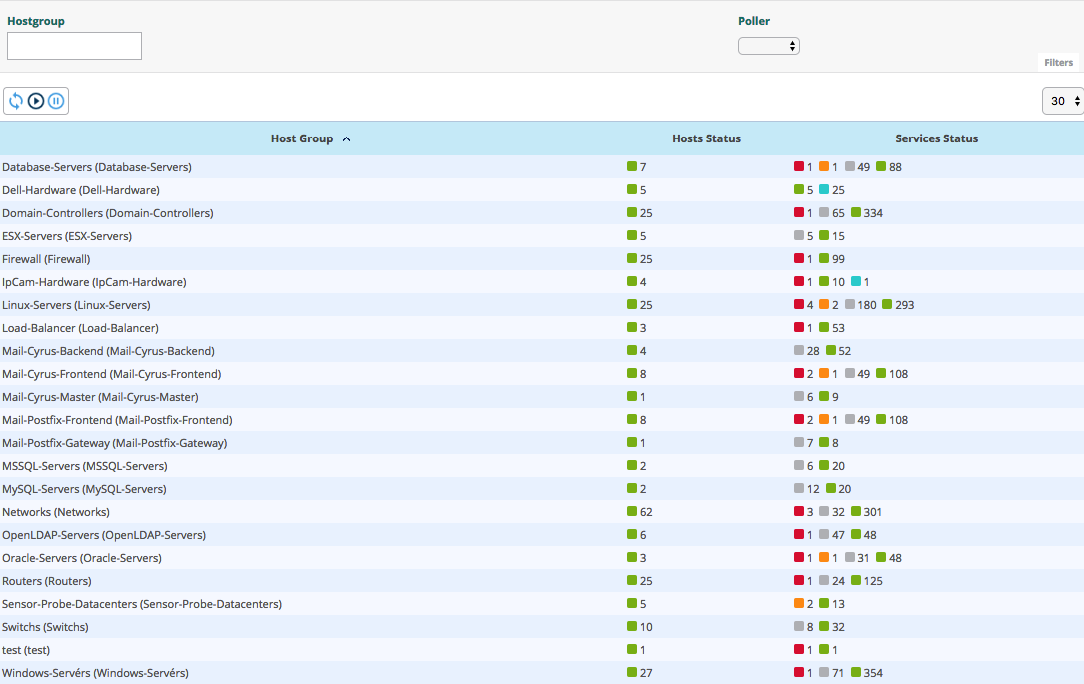
Columns description
- Host Group: List of available groups of hosts
- Hosts Status: Displays the number of hosts in UP, DOWN, UNREACHABLE or in PENDING status
- Services Status: Used to display the number of services in OK, WARNING, CRITICAL or PENDING status
Available filters
- Hostgroup: Can be used to filter by name of group of hosts via an SQL LIKE type search.
- Poller: Can be used to filter the hosts by poller. Only the hosts of the selected poller will be displayed.
Host details (deprecated)
This interface is deprecated and replaced by the
Resources Statuspage and the host panel.
When you click the name of a host, you access the details page of the resource.
4 tabs are available:
- Service Status: List of host services and their associated status
- Performances: List of performance graphs for each service
- Host Information: Host details
- Comments: Host comments available
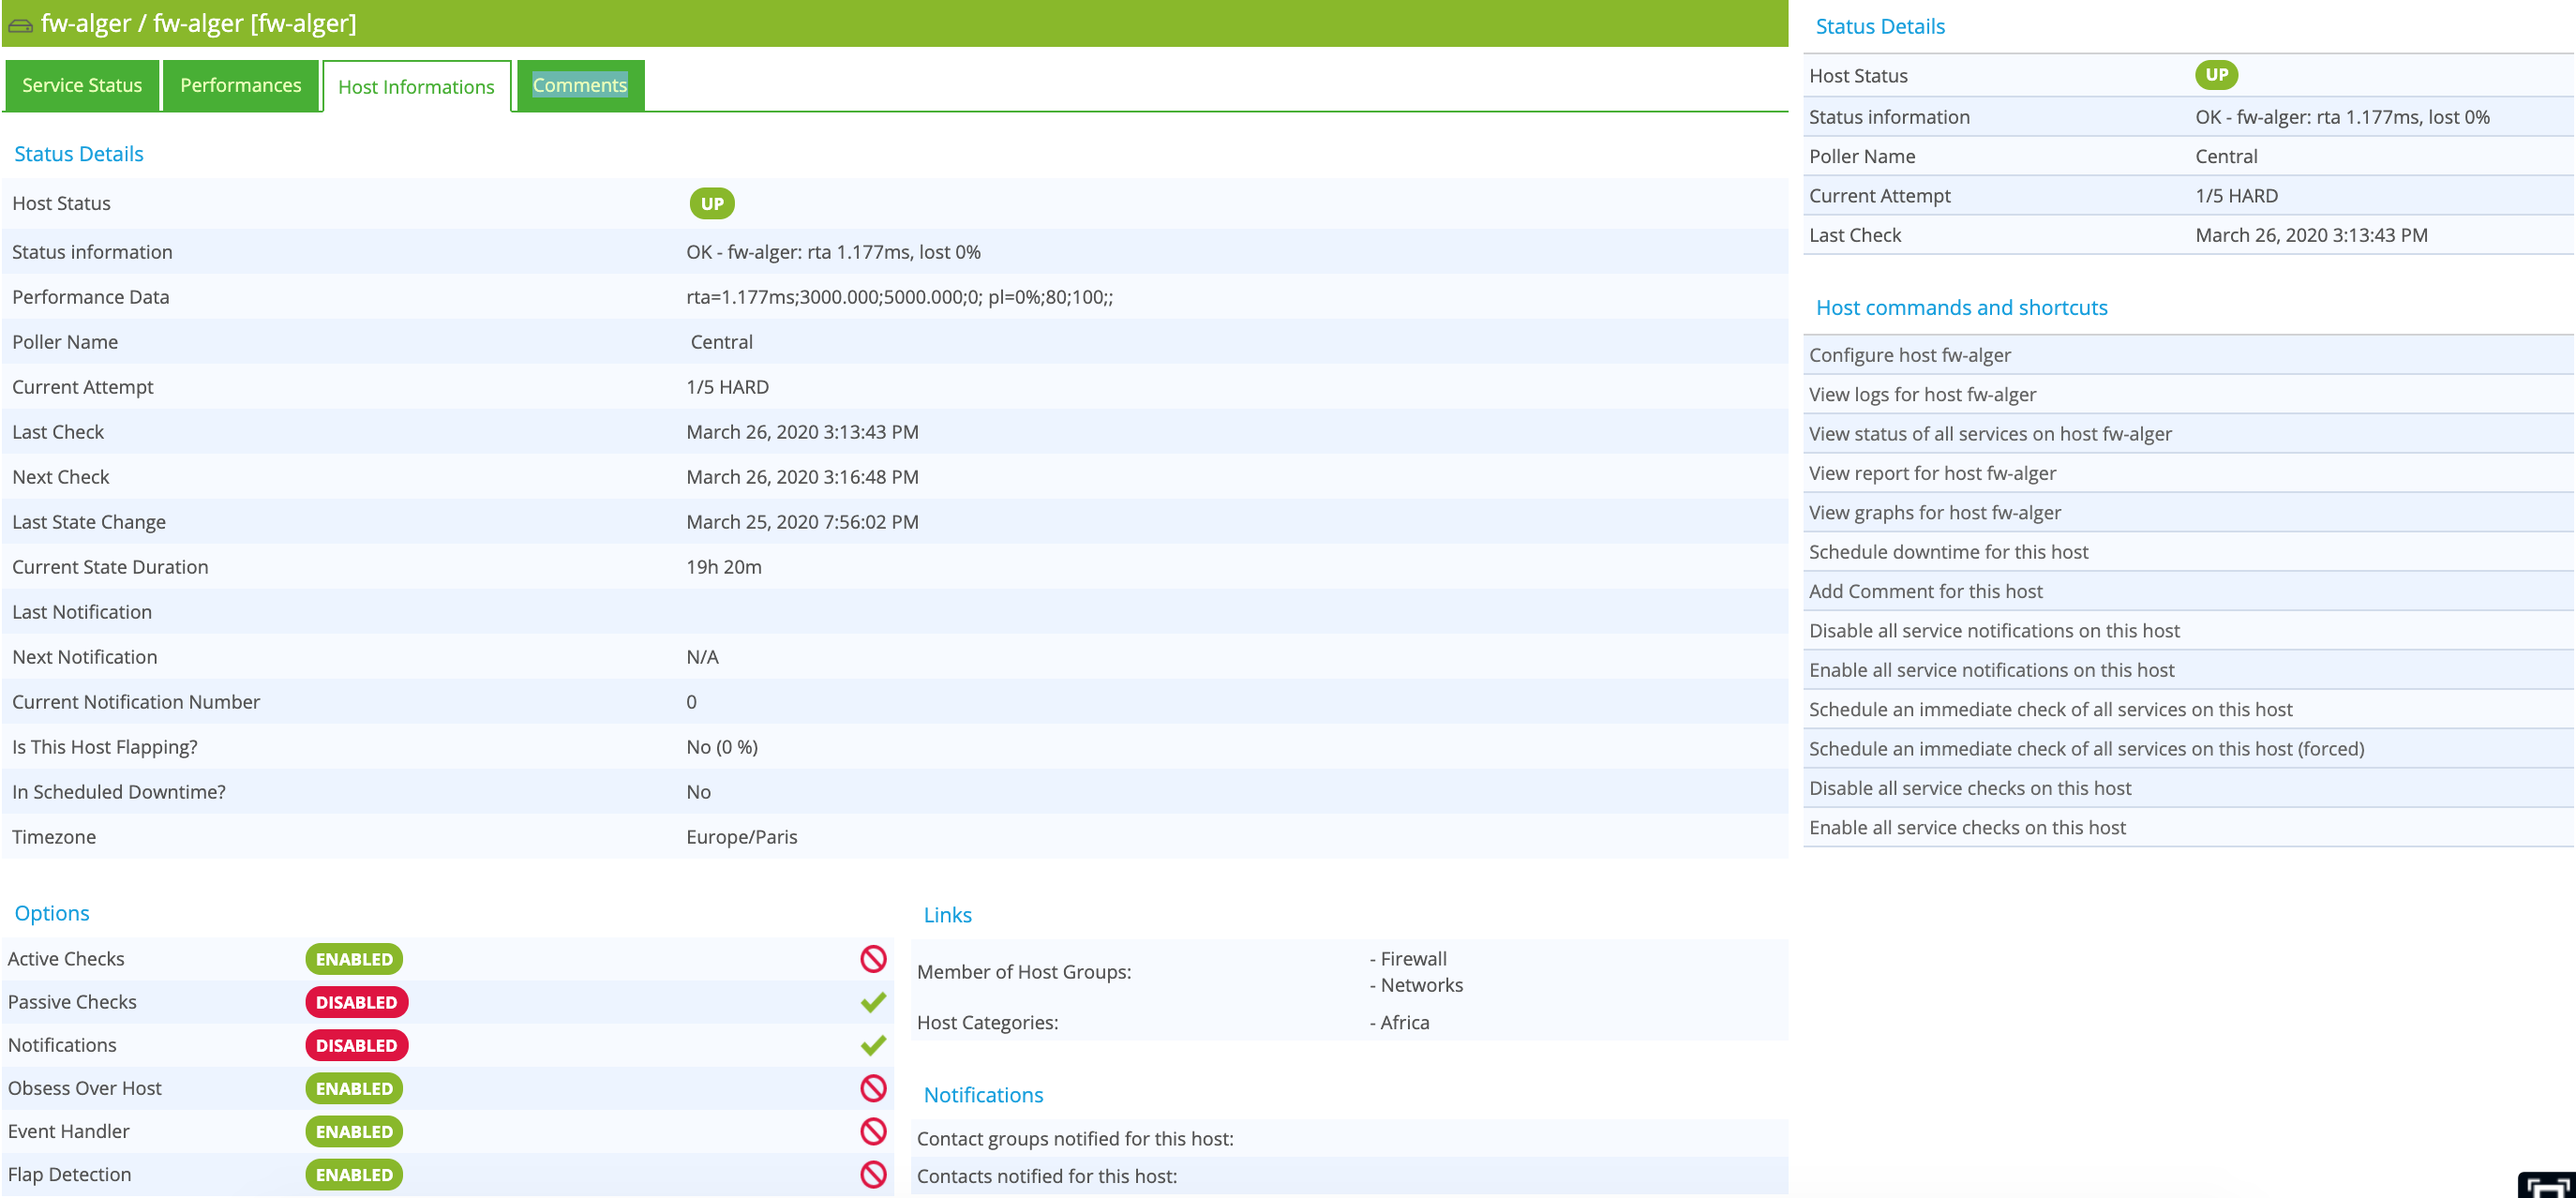
Status details
Description of attributes available for host details:
- Host Status: Displays the status of the host.
- Status information: Displays information on the status of the host.
- Performance Data: Displays performance data associated with the check.
- Poller Name: Name of the server polling the host.
- Current Attempt: Displays the number of attempts before status validation.
- State Type: Displays the type of state (‘SOFT' or ‘HARD').
- Last Check: Displays the last check of the host.
- Next Check: Displays the next scheduled check of the host.
- Last State Change: Displays when the status of the host changed.
- Current State Duration: Displays the date and time from which the host has been in the present state.
- Last Notification: Displays the sent date and time of the last notification.
- Next Notification: Displays the sent date and time of the next notification.
- Current Notification Number: Displays the number of sent notifications.
- Is This Host Flapping?: Indicates if the host is in flapping state.
- In Scheduled Downtime?: Indicates if the host is in scheduled downtime.
- Timezone: The timezone of the host.
Options
Options to enable / disable properties of the host:
- Active Checks: The active check method of the host.
- Passive Checks: The passive check method of the host.
- Notifications: The notification process of the host.
- Obsess Over Host: The execution of the ‘obsess over host’ command for the host.
- Event Handler: The automated reactions process of the host.
- Flap Detection: The flapping detection process of the host.
Links
The Links container displays the host's membership of host groups and categories.
Notifications
The Notifications container lets you display the contacts and contact groups linked to the host that will receive notifications.
Services (deprecated)
This interface is deprecated and replaced by the
Resources Statuspage and the events list.
To view the service status, go into the Monitoring > Status Details > Services menu.
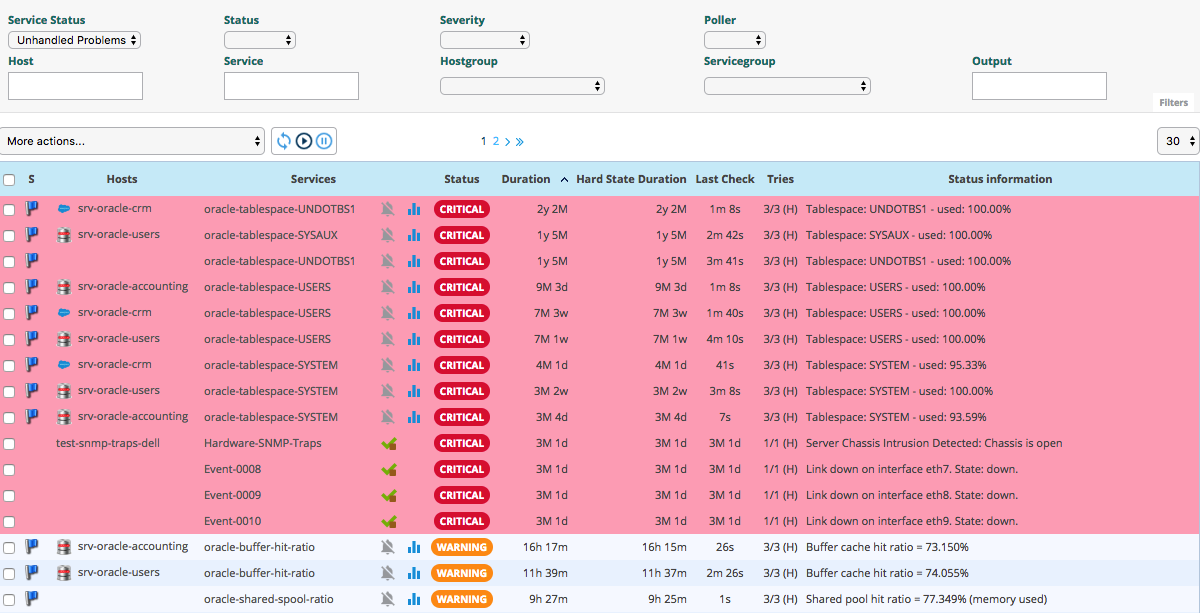
Columns description
- S: Displays the severity level of the service.
- Host: Displays the name of the host.
- Services: Displays the name of the service.
- The following icon indicates that the notifications for this
service are disabled:
- The following icon can be used to view the performance graph for
this service:
- The following icon allows access to a configured predefined URL:
- The following icon indicates that the notifications for this
service are disabled:
- Duration: Displays the duration of the current status.
- Hard State Duration: Displays the duration of the validated non-ok status.
- Last Check: Displays the date and time of the last check.
- Tries: Displays the number of attempts before status validation.
- Status information: Displays the message explaining the status of the service.
The severity column and the associated filter appear if at least one object displayed has a severity level.
The Hard State Duration does not appear if you select the value All for the Service Status filter.
Available filters
- Service Status:
- To view the services with a problem that is not acknowledged or not in downtime, choose Unhandled Problems.
- To view all the services with a problem, choose Host Problems.
- To view all the services, choose All.
- Status: Can be used to filter by the status of services.
- Severity: Can be used to filter by severity.
- Poller: Can be used to filter the services by poller. Only the services of the selected poller will be displayed.
- Host: Can be used to filter by name of host via an SQL LIKE type search.
- Service: Can be used to filter by name of service via an SQL LIKE type search.
- Hostgroup: Can be used to filter by host group. Only the hosts of the selected host group will be displayed.
- Servicegroup: Can be used to filter by service group. Only the services of the service group selected will be displayed.
- Output: Can be used to filter by the result of the check.
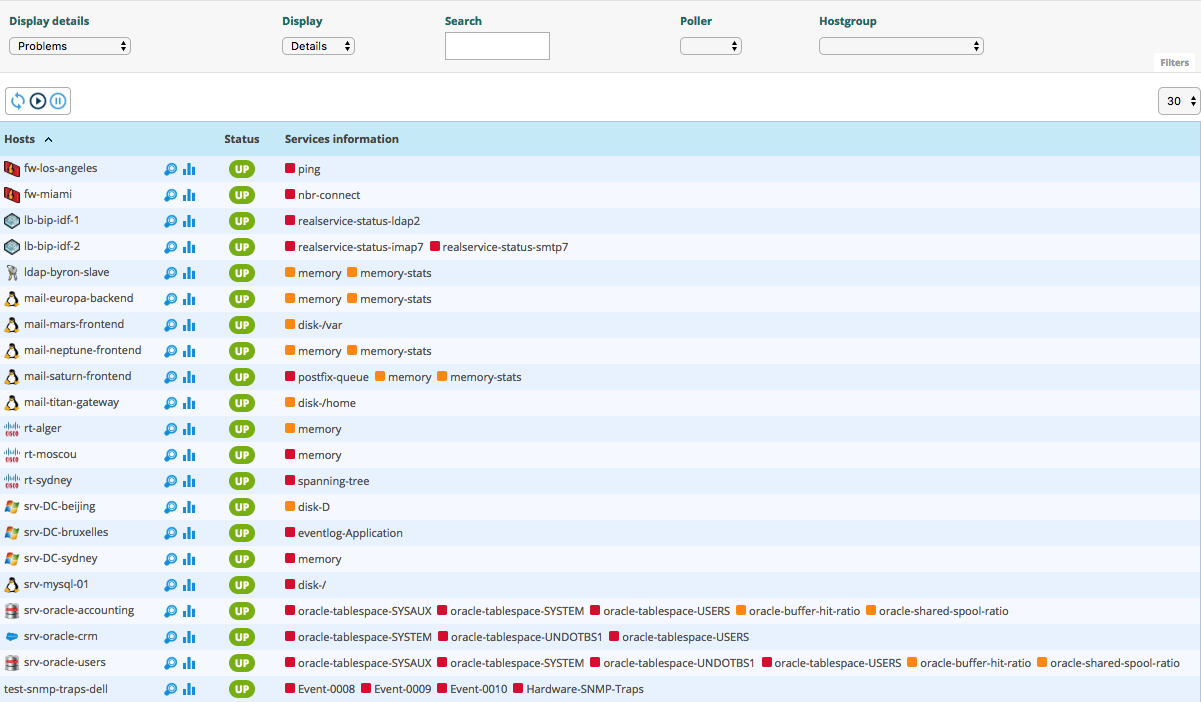
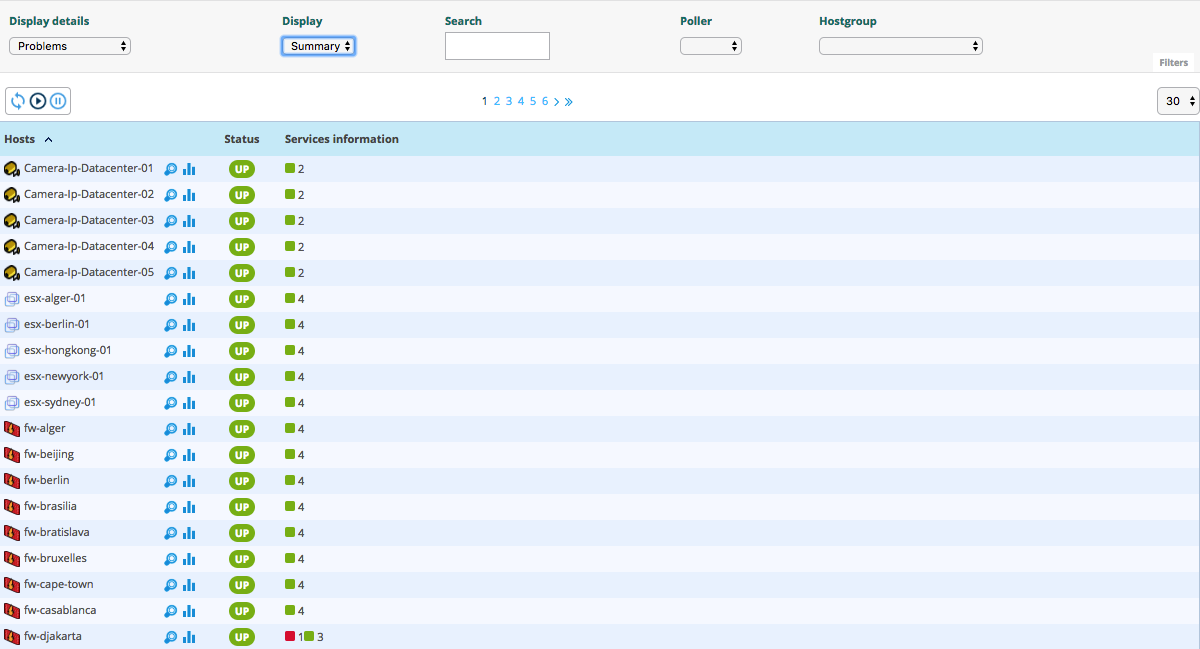
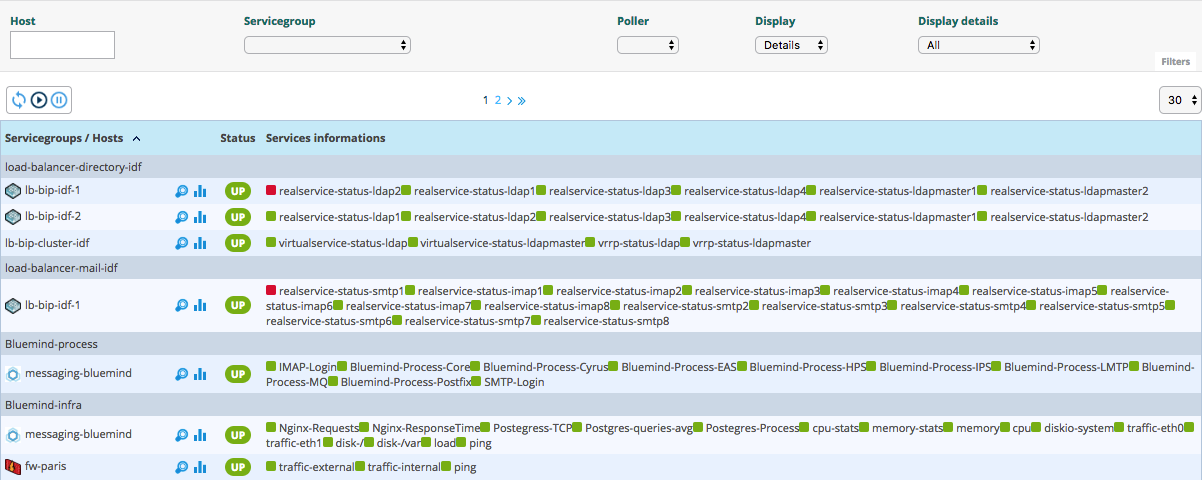
Services Grid
To view all services (short by host) in any status, go into the Monitoring > Status Details > Services Grid menu and choose Details for Display
filter:
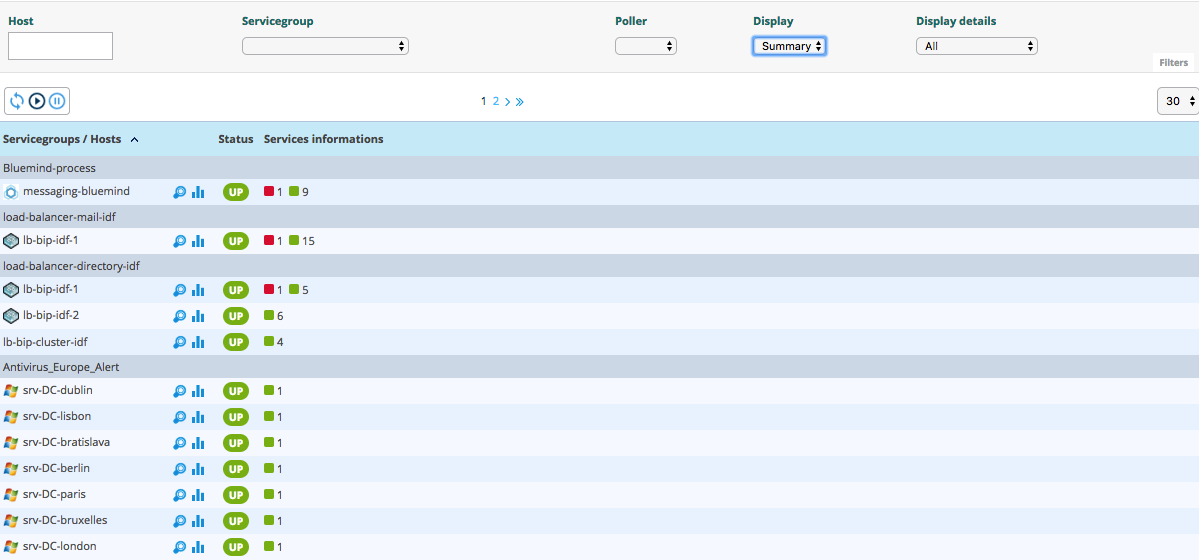
To view the number of services (short by host and by status), choose Summary Display filter:
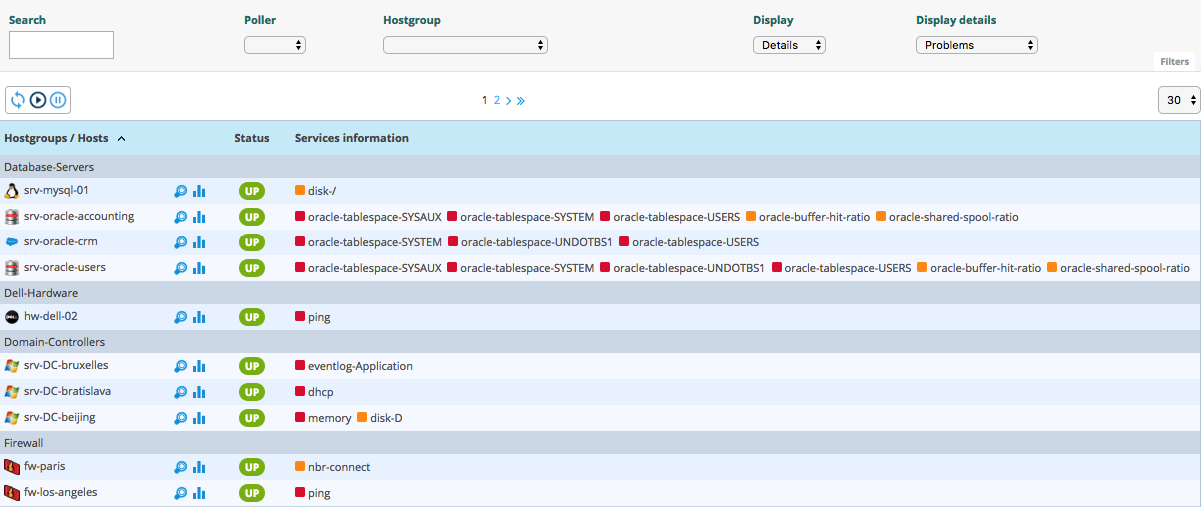
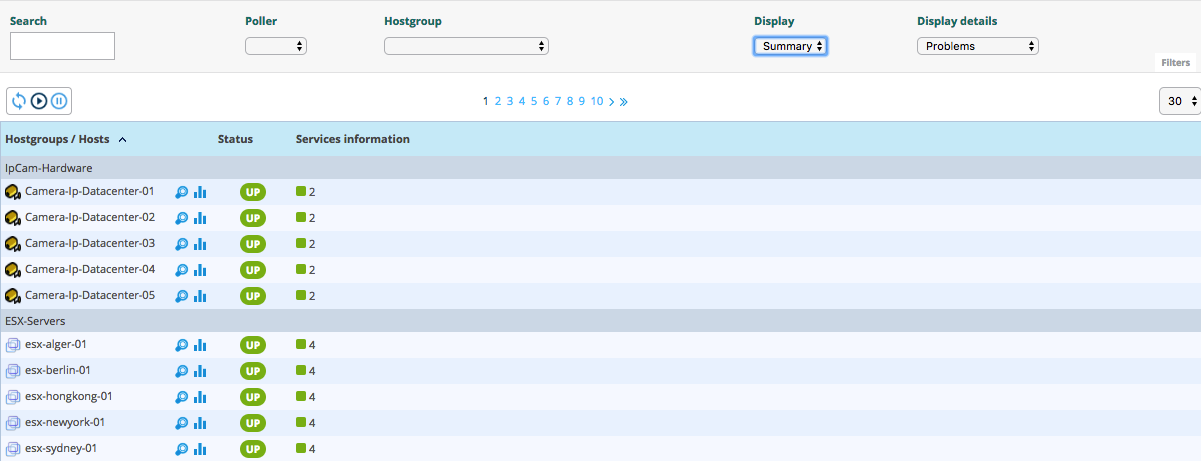
Services by Hostgroup
To view the all services (short by host's groups) in any status, go into the
Monitoring > Status Details > Services by Hostgroup menu and choose
Details for the Display filter:
To view the number of services (short by host's groups), choose Summary for the Display filter:
Services by Servicegroup
To view all services (sorted by service groups), go into the Monitoring > Status Details > Services by Servicegroup menu and choose Details for the Display filter:
To view the number of services (short by services groups), choose Summary for the Display filter:
Service Details (deprecated)
This interface is deprecated and replaced by the
Resources Statuspage and the service panel.
When you click on a service, the following screen appears:
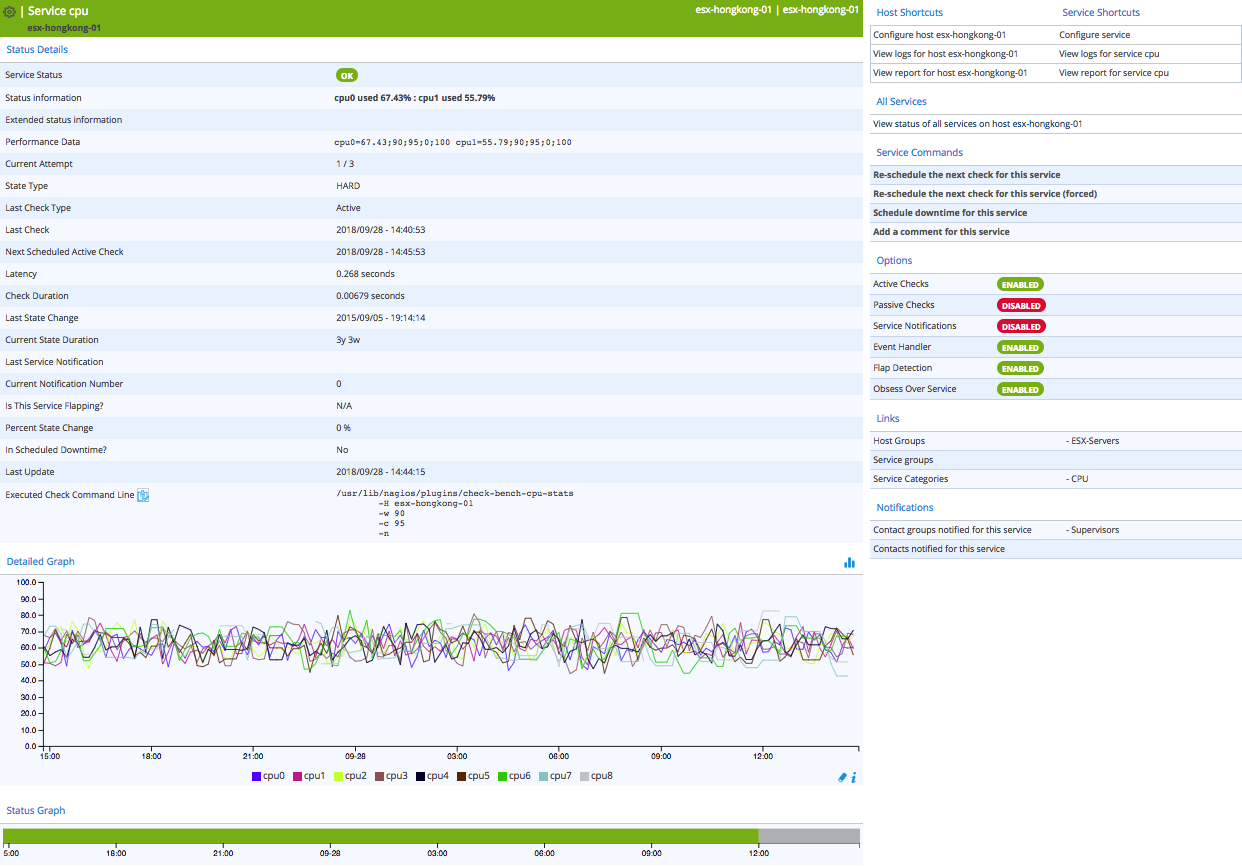
Status details
Description of attributes available for service details:
- Service Status: Displays the status of the service.
- Status information: Displays information on the status of the service.
- Extended status information: Displays long output of the service.
- Performance Data: Displays performance data associated with the check.
- Current Attempt: Displays the number of attempts before status validation.
- State Type: Displays the type of state (‘SOFT' or ‘HARD').
- Last Check Type: Indicates if the last type of check is ‘active' or ‘passive'.
- Last Check: Displays the last check of the service.
- Next Scheduled Active Check: Displays the next scheduled check of the service.
- Latency: Displays the latency in seconds between the scheduled check and the real check execution.
- Check Duration: Displays the execution time of the check.
- Last State Change: Displays when the status of the service changed.
- Current State Duration: Displays the date and time from which the host has been in the present state.
- Last Service Notification: Displays the sent date and time of the last notification.
- Current Notification Number: Displays the number of sent notifications.
- Is This Service Flapping?: Indicates if the service is in flapping state.
- Percent State Change: Displays the percentage change of state.
- In Scheduled Downtime?: Indicates if the host is in scheduled downtime.
- Last Update: Displays the date and time of the last information update.
- Executed Check Command Line: Regarding your ACL rights, you may have access to the executed command line. The password will be replaced by *
Detailed graph and status graph
The Detailed Graph and Status Graph are used to display performance graphs and the status history chart for this service.
Host and Service Shortcuts
- View host status page: Provides access to the host details page.
- Configure host: Provides access to the configuration page of the host.
- View logs for host: Provides access to the event logs of the host.
- View report for host: Provides access to the host availability rate report.
- View graphs for host: Provides access to all performance graphs of host services.
- Configure service: Provides access to the configuration page of the service.
- View logs for service: Provides access to the event logs of the service.
- View report for service: Provides access to the service availability rate report.
Service commands
- Re-schedule the next check for this service: Used to re-schedule the next check for the service.
- Re-schedule the next check for this service (forced): Used to re-schedule the next check for the service, even if the check period is invalid.
- Schedule downtime for this service: Used to schedule downtime for the service.
- Add a comment for this service: Used to add a comment for the service.
Options
Options to enable / disable properties of the service:
- Active Checks: The active check method of the service.
- Passive Checks: The passive check method of the service.
- Notifications: The notification process of the service.
- Event Handler: The automated reactions process of the service.
- Flap Detection: The flapping detection process of the service.
- Obsess Over Service: Execution of the ‘obsess over service’ command for the service.
Links
The Links container is used to display:
- The groups of hosts to which this service is linked.
- The groups of services to which this service is linked.
- The categories of services to which this service is linked.
Notifications
The Notifications container lets you display the contacts and contact groups linked to the host that will receive notifications.