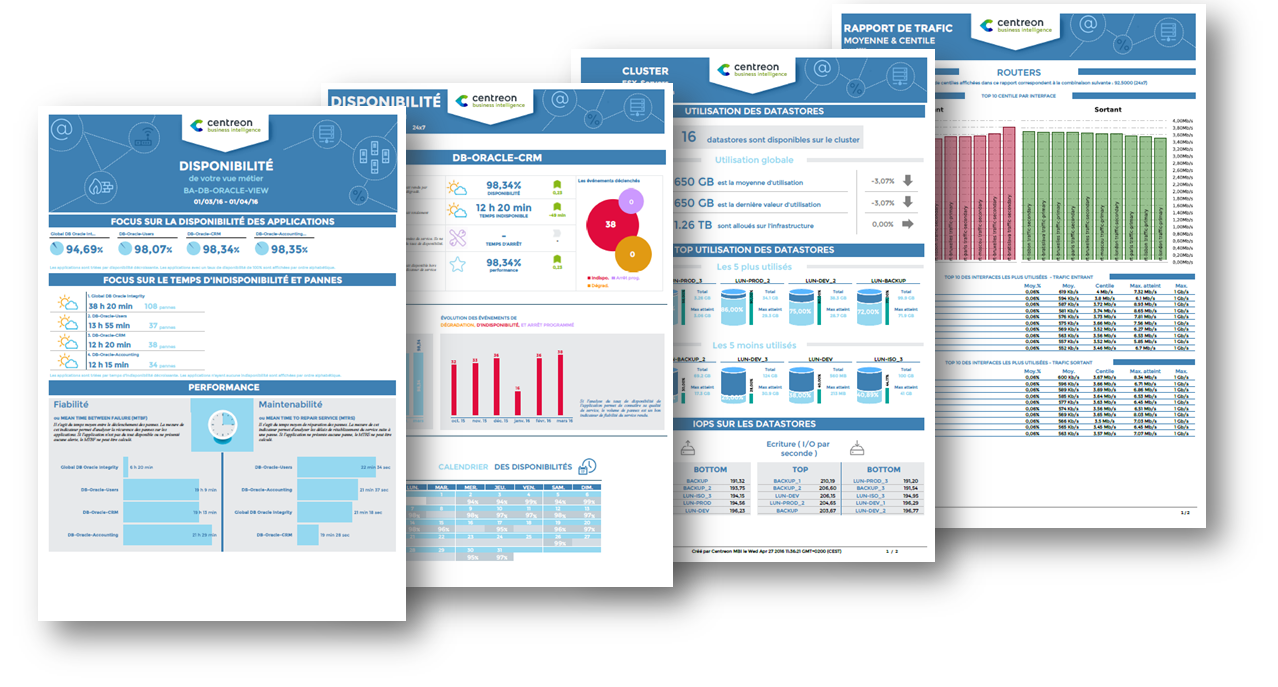
Generate reports
This chapter describes features you need to manipulate to be able to generate & manage reports.
Jobs
A job is an entity that you configure to be able to generate a report and should be configured in terms of:
- A report design to use
- Centreon objects (hosts, services, host groups, service groups, business activities, etc.)
- A specific period (last month, current month, yesterday etc.. )
Job list
The following menu lists jobs according to their state: running,
scheduled, failed, stopped or finished:
Reporting > Business Intelligence > Configuration > Jobs
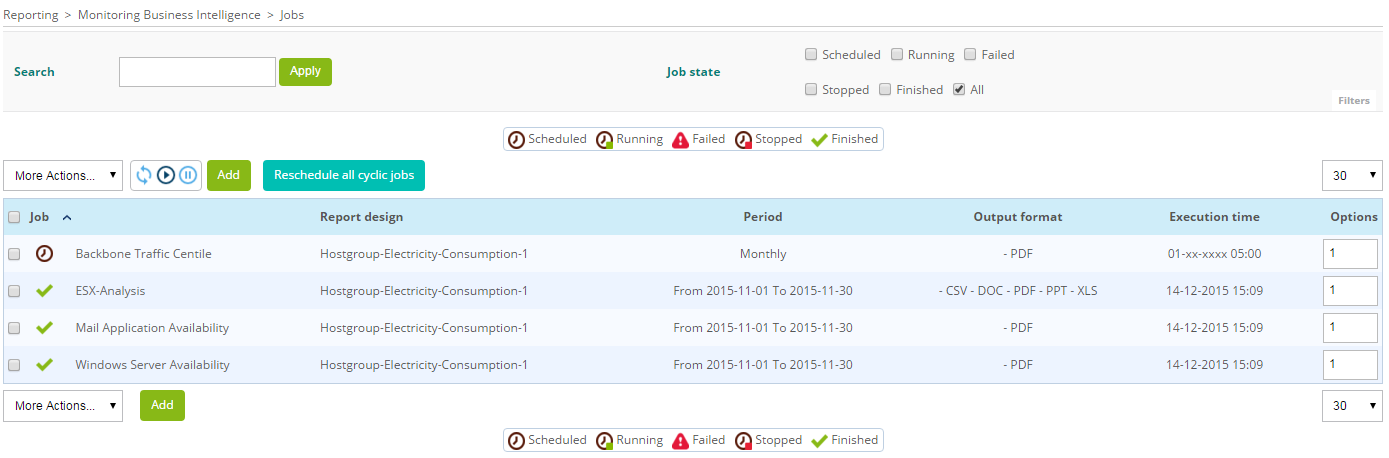
Description of columns:
| Column | Description |
|---|---|
| Name | Name of scheduled job |
| Report design | Design to be used for report |
| Period | Period covered for generated report |
| Output format | Export formats of generated report (PDF, Excel, Powerpoint,CSV, DOC) |
| Execution time | Execution date and time of scheduled job |
| Options | Number of job duplications if the duplication option is selected in the menu "More Actions" |
In the "Name" column on the table, an icon is displayed according to the job state:
| Icon | Status |
|---|---|
| Job stopped | |
| Job scheduled | |
| Job being executed | |
| Job ended (only for a single-use job) | |
| Job failed or canceled |
Search filters
Search filters are available for quick access to jobs:

The "Search" field allows to filter by job name and "Job state" filters by job state.
Description of the different states:
| State | Description |
|---|---|
| Scheduled | Job planned, will be executed |
| Running | Job running, the report is being generated |
| Failed | Job failed |
| Stopped | Job stopped, will not be executed |
| Finished | Job is completed, report has been generated. This state appears only for single jobs. Cyclic jobs return to the "Scheduled" state once the report is generated |
| All | All states displayed |
Refreshing the job list
The following icons allow you to dynamically update the job list:
| Icon | Description |
|---|---|
| Manually refresh the list and state of each job. | |
| Start or stop the automatic refresh of the page |
More action menu
The action menu allows you to perform a variety of tasks on one or more jobs in the list.

The following table describes the different options:
| Action | Description |
|---|---|
| Trash | Sends the selected jobs to the trash. |
| Stop | Stops the selected jobs. |
| Reschedule | Schedules/Runs the selected jobs. |
| Duplicate | Duplicates the selected jobs. All settings and relations will also be duplicated. |
Adding / Editing a job
To generate a report, you need to create a job by clicking "Add" in the job listing page. Configuring a job is done in two main steps (tabs):
- Select the report design you want to use (see all the designs available here)
- Select the perimeter on which to generate the report
Two optional steps (tabs) can be done to:
- Publish the report
- Tune the job
The following menu is used for adding a new scheduled job:
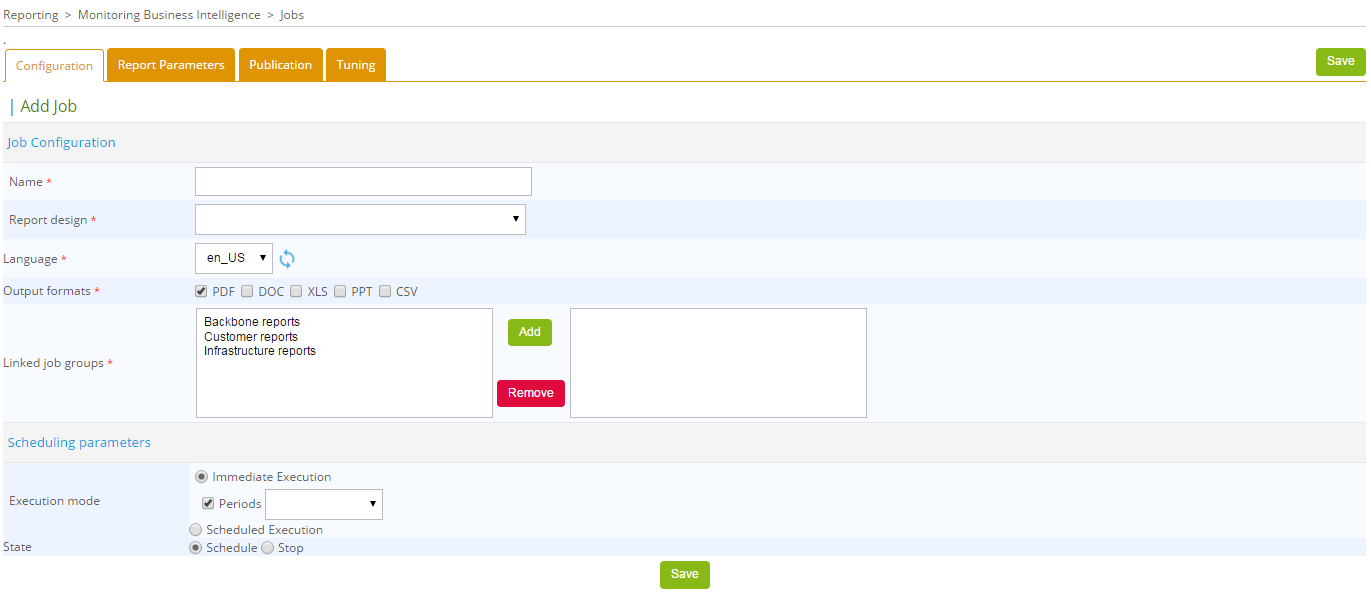
- 1. Configuration
- 2. Report parameters
- 3. Report publication (Optional)
- 4. Tuning (Optional)
A report generation job must be linked to a report design ("Report design").
Several report output formats are available:
- Acrobat PDF
- Microsoft Excel
- Microsoft Word
- Microsoft Powerpoint
- CSV: Only the first BIRT Data Set of the report can be exported in CSV format. Usually, this format requires a specially designed BIRT report.
Reports can be generated in other languages. Currently available languages are:
- French
- US English
The icon on the right of the selection menu allows you to refresh the list of available report languages in the case you want to add a translation yourself
Scheduling
A job can be executed in three different ways: immediately, scheduled for later, or in a cyclic way.
Immediate execution
The job will start when saving the form.

SCHEDULED > One shot
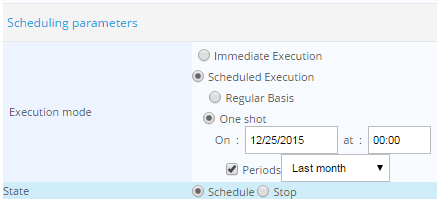
CYCLIC
This parameter causes the job to run on a daily, weekly or monthly basis.

For cyclic jobs, the period is calculated automatically according to job frequency:
- Daily reports cover the previous day.
- Weekly reports cover the previous week.
- Monthly reports cover the previous month.
The "Report Parameters" menu is used to set the specific parameters for the report design.
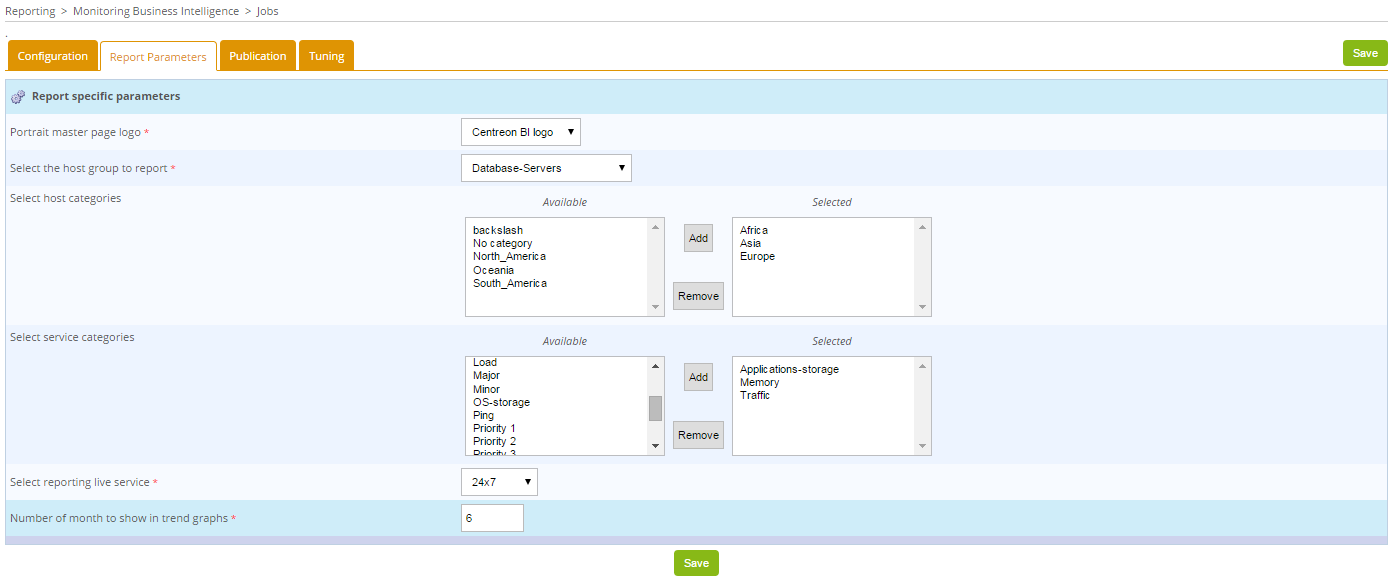
This part of the menu changes according to the report design selected under the "Configuration" tab of the scheduled job.
There are three types of field in this form:
-
Text fields
-
Radio buttons
-
Selection and multi-selection menus for the following resources:
- Hosts
- Metrics
- Host groups
- Service groups
- Service categories
- Time periods
- Business groups (Centreon BAM module is required)
- Business activities (Centreon BAM module is required)
- Images that will be inserted in the reports (logo for example).
In the Time period field for reports concerning BAM, do not use time periods that include exceptions, as the exceptions will not not be taken into account.
Note: A value must be specified for each field in this menu except for the multi-selection parameter when metrics are excluded.
By default, all metrics will be applied.
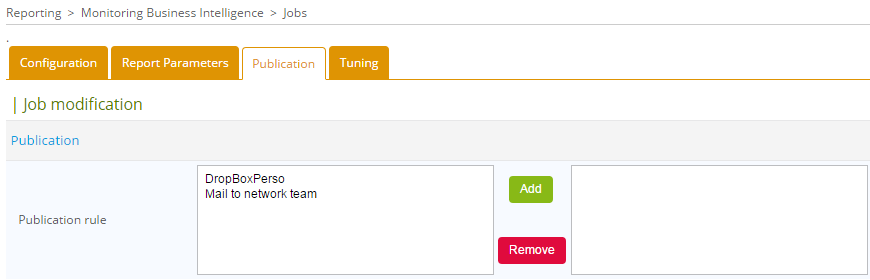
Once a report is generated, it can be automatically published using pre-defined rules. When creating a job, you can create several rules under the "Publication" tab.
The "Tuning" menu contains three parameters:
-
Report color theme: Color theme management has been implemented, allowing you to choose a color palette. Seven default themes are available: Maroon, Orange, Blue, Ice, Green, Multicolor-1 and Multicolor-2.
Theme color does not apply to business activity reports
The available color palettes are:
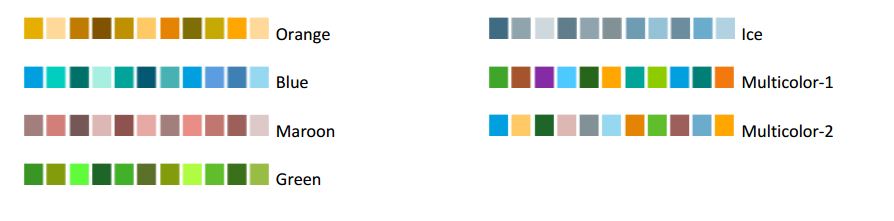
The default color theme can be changed through the Centreon MBI General options menu. For more information, see the General options chapter General options
-
Multiplier coefficient of the scheduled task: Each report design has a weight. A scheduled task can multiply this weight according to the parameters used to run the report design. The sum of the weight of the running tasks cannot exceed the maximum load the reporting engine can handle (defined in General Options).
-
Administrator e-mail notification: Enable or disable notification when scheduled job is generated.
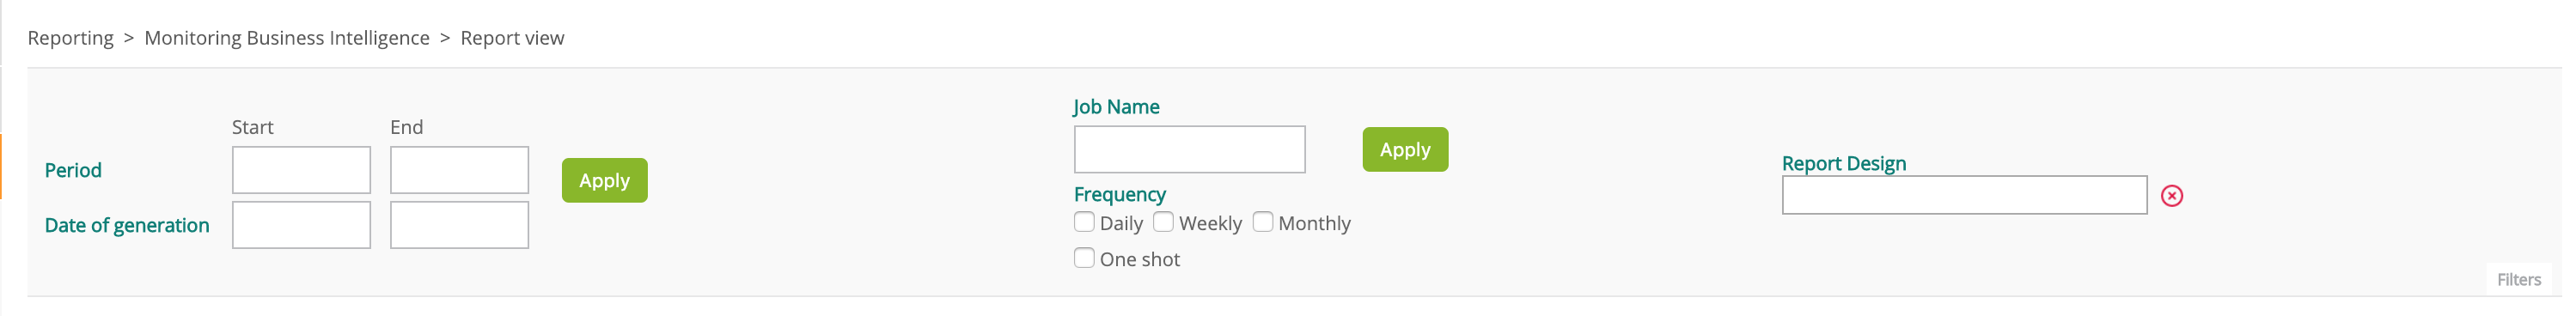
Accessing generated reports
After a scheduled job is executed, a new report is generated and then stored on the Centreon server. You can then view or download it using the following menu Reporting > Monitoring Business Intelligence > Report view
The following table lists the reports generated:
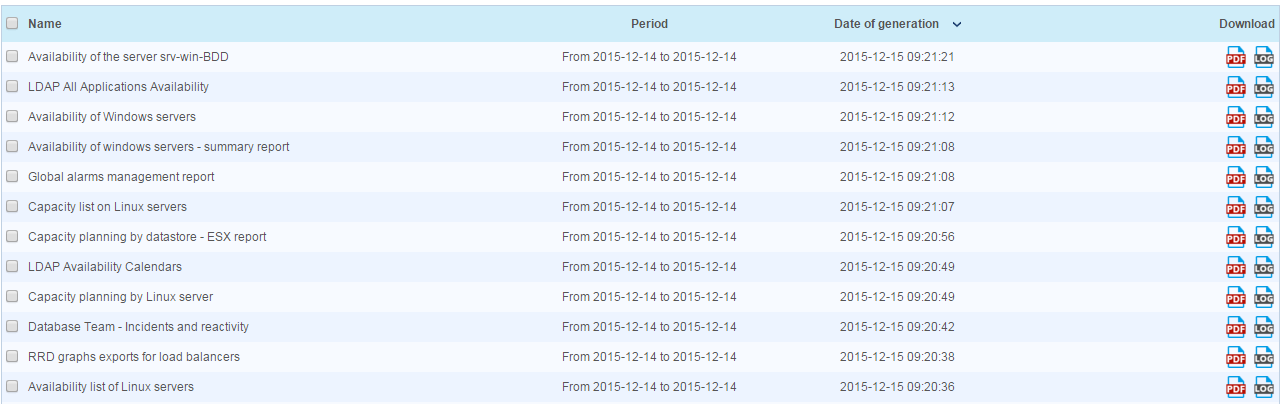
| Column | Description |
|---|---|
| Name | Name of the report |
| Period | Period in which data was selected to build the statistics |
| Date of generation | Date the report was generated |
| Download | Link for downloading the file |
Search filters
You can search in any of these criteria:
- Period: chosen period on which to generate the report
- Date of generation: when was the report generated
- Frequency (daily, monthly, etc.)
- Search by job name (applies to the "Name" column)
- Search by report design
Action menu
Use the action menu to move reports that are no longer needed to the trash:

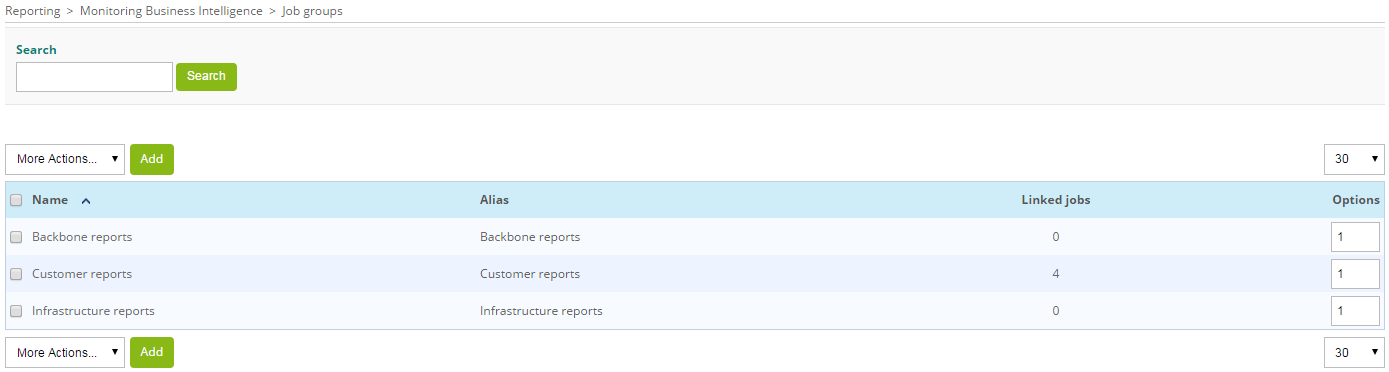
Job groups
Job groups are used to manage user access to reports and mail publication
Job group list
The following menu lists all job groups available on Centreon MBI:
Reporting > Monitoring Business Intelligence > Configuration | Job groups
More action menu

| Action | Description |
|---|
- Delete | Delete group
- Duplicate | Duplicate group
Add / Edit
A job group can be added or modified through the following menu:
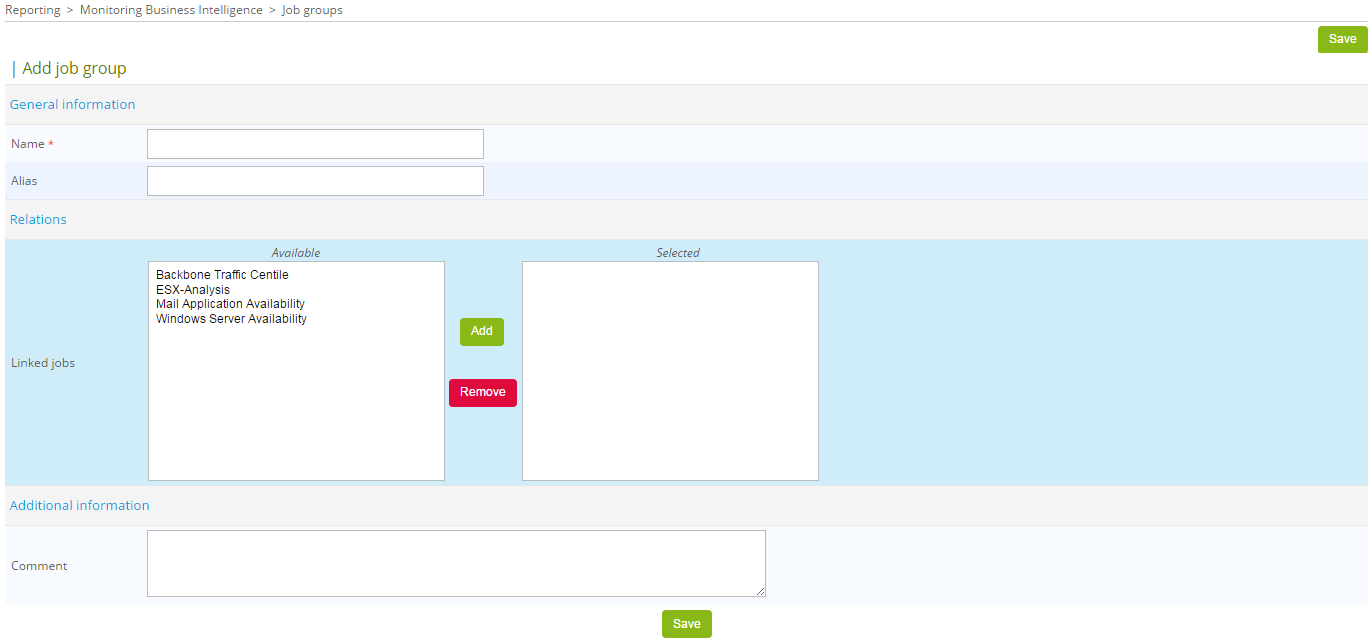
Description of menu fields:
| Column | Description |
|---|---|
| Name | Job group name |
| Description | Job group description |
| Linked job | Jobs linked to group |
Report design
The design of the reports you generate with Centreon MBI originates from ".rptdesign" files, which are created with the open-source tool Business Intelligence Reporting Tool (BIRT).
To generate a report, a report design should be configured in terms of:
- Centreon objects (hosts, services, host groups, service groups, business activities, etc.)
- A specific period (monthly report, weekly report, etc.).
Each report design can have a several parameters, which must be defined in the Centreon interface.
Report design list
The following menu lists the report designs available in Centreon MBI
Reporting > Monitoring Business Intelligence > Configuration > Report Design
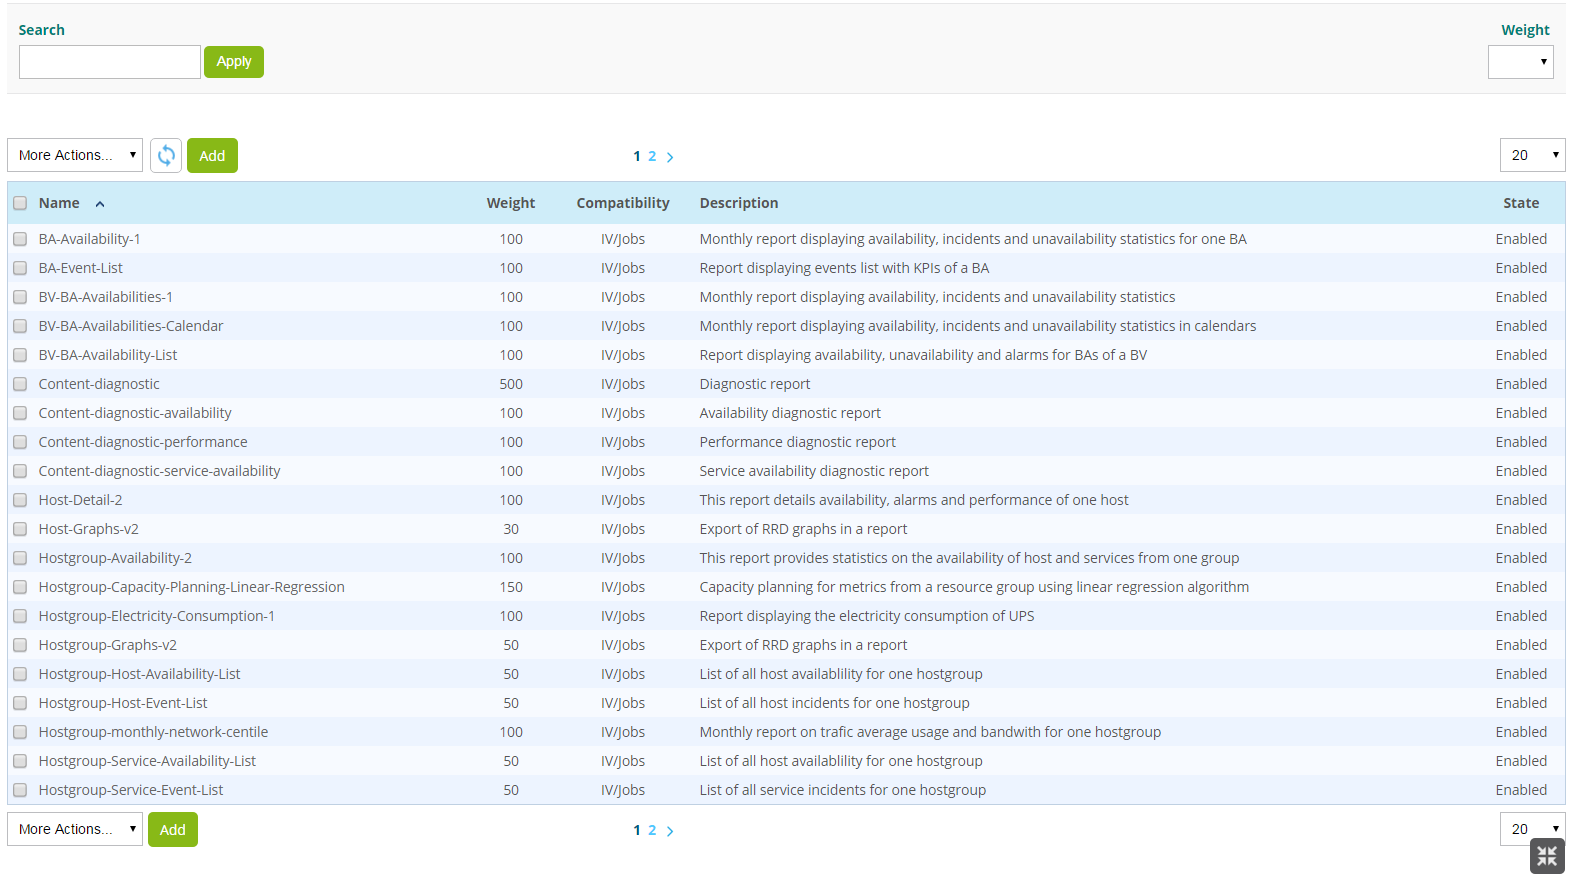
Description of the above table:
| Column | Description |
|---|---|
| Name | Name of report design |
| Description | Short description of report design |
| State | Status of report design (Enabled/Disabled) |
| Weight | Report weight: report generation workload index. |
Add / edit
A report design can be edited or a new one can be added if you develop your own reports (using BIRT)
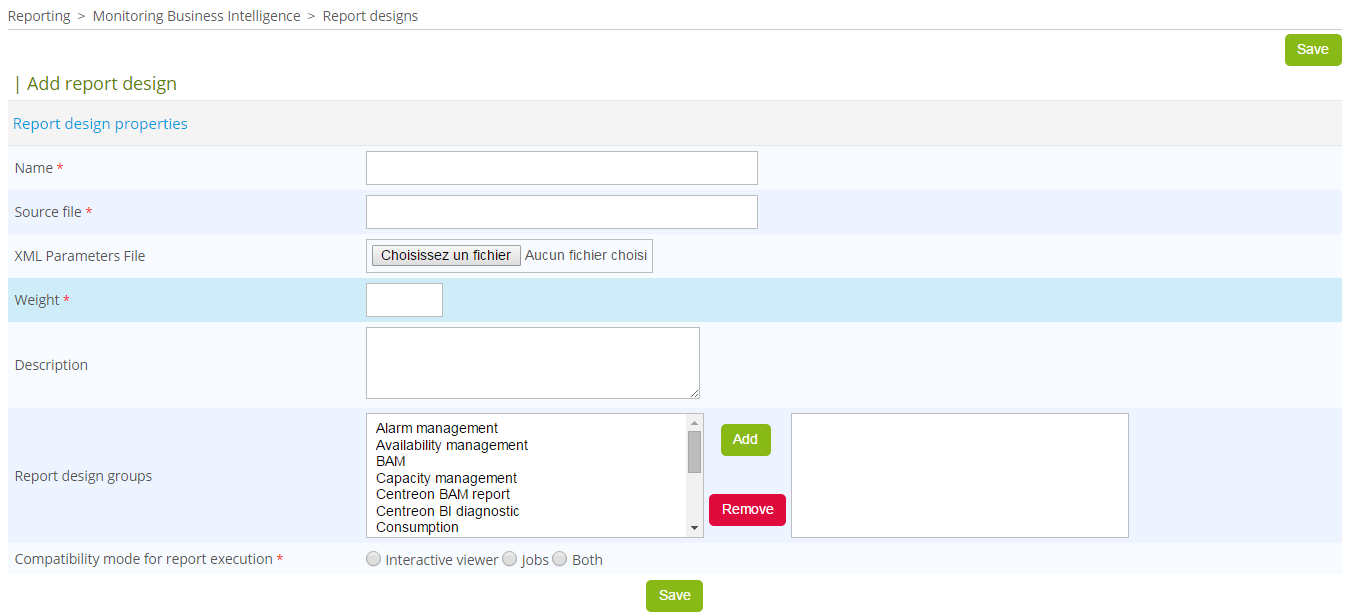
Description of the menu fields:
| Fields | Description |
|---|---|
| Name | Name of report design |
| Report Source file | Name of the ". rptdesign" BIRT file corresponding to the report design. This file is stored in the "reports/" directory of "Centreon MBI" installation directory. |
| Description | Short description of report design. |
| XML parameters file | Each report can have several specific parameters. This .xml file defines those parameters. |
| Weight | Report weight: report generation workload index. |
| Report design groups | Report design group linked to report design for ACL management. |
Only Centreon administrators are authorized to edit report designs or add a new one. Users without privileges only have read-only access to existing report designs.
Action menu
The "More actions" menu allows you to perform certain actions on report designs:
| Action | Description |
|---|---|
| Trash | Move file to trash. |
| Activate | Enable a report design for report generation. |
| Deactivate | Disable a report design for report generation. |
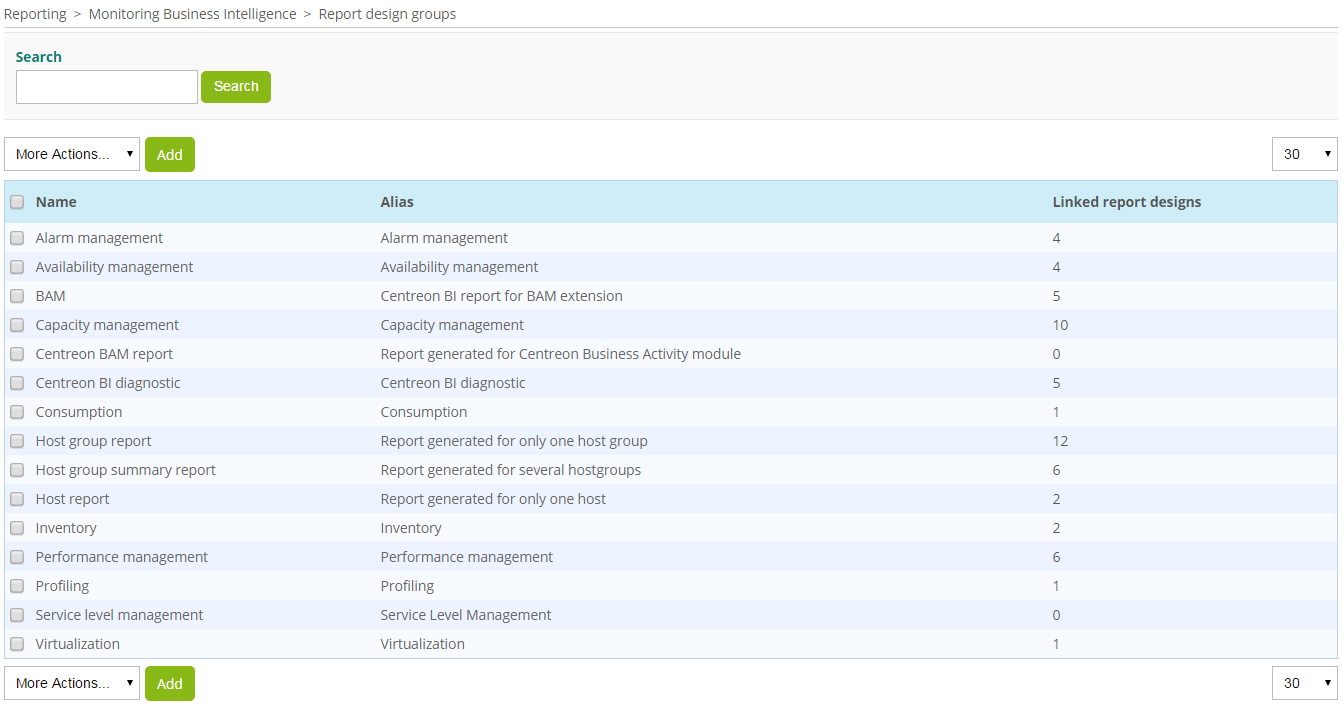
Report design groups
Report design group list
The following menu lists all report design groups available on Centreon MBI Reporting > Monitoring Business Intelligence > Configuration > Report design groups
Add / Edit
The following menu is used for adding or editing a report design group:
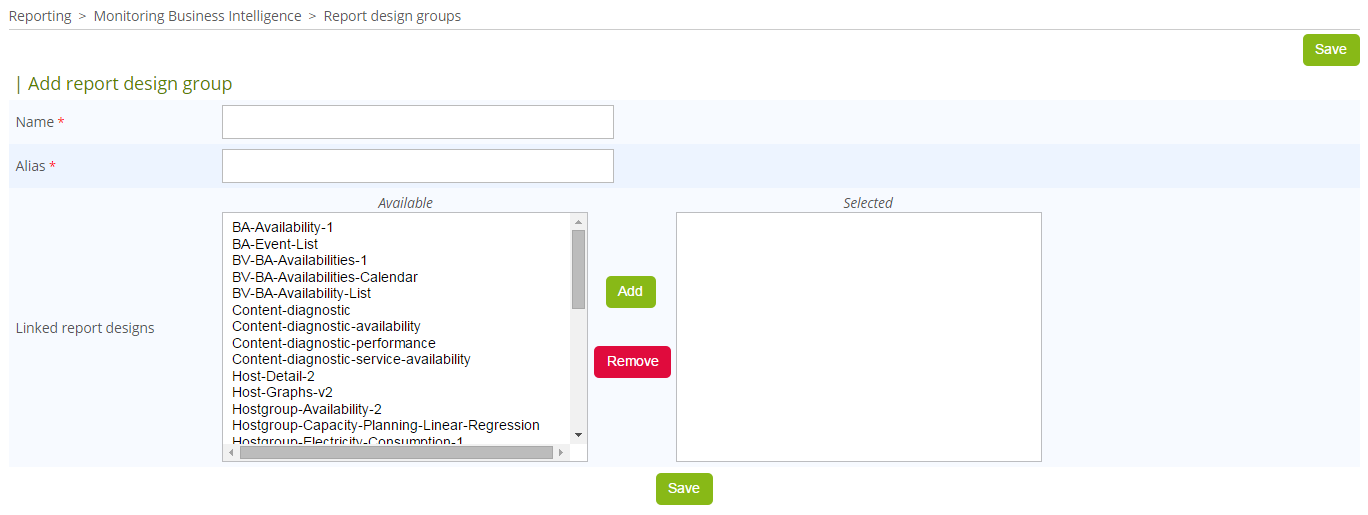
| Column | Description |
|---|---|
| Name | Name of report design group |
| Description | Short description of report design group |
| Linked report designs | Report designs linked to the group |
Logo
You can store images in the Centreon MBI configuration for reuse in future reports to be generated. Use the selection menu to incorporate an image (or logo) into the desired report design.
Regardless of the size of the image (or logo), it must have an aspect ratio of 4:4 to fit into the required space.
Image list
The following menu lists all the images available:
Reporting > Business Intelligence > Configuration > Logo
![]()
Description of columns:
| Column | Description |
|---|---|
| Name | Image name |
| Preview | Display loaded image |
| Type | Image format: PNG, JPEG or GIF |
| Size | Image size (width x height) |
Add/Edit images
To add a new image, click "Add" and then fill in the following menu fields:
![]()
Description of fields:
| Column | Description |
|---|---|
| Name | Name of image. No special characters allowed |
| Image | Image source file |
Action menu
Use the following menu to delete images from the list. You cannot, however, delete images already linked to jobs generating reports.

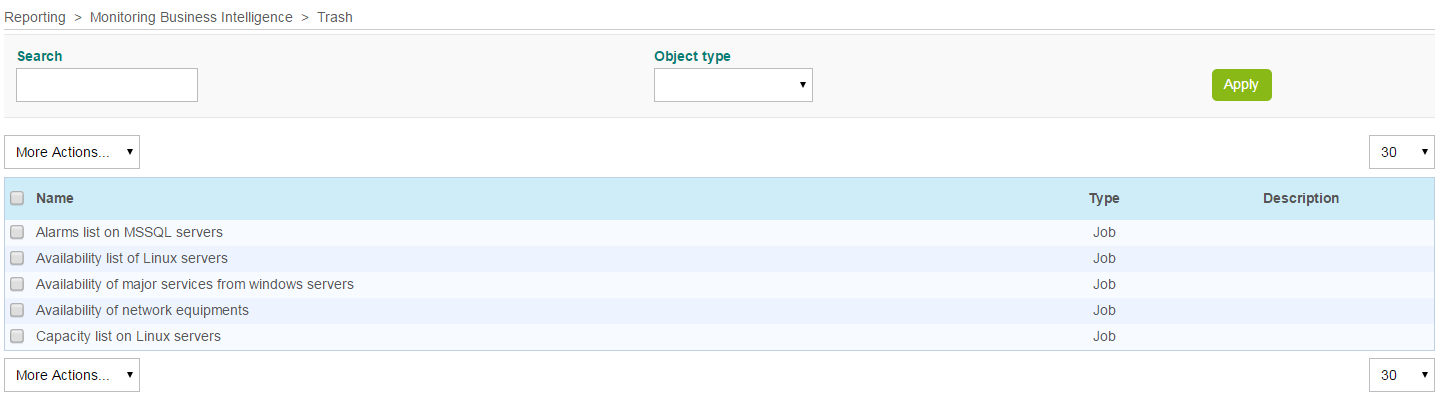
Trash
All deleted report designs or scheduled jobs are first sent to the trash, as a security measure, before being permanently deleted. Use the following menu to access the trash:
Reporting > Monitoring Business Intelligence > Administration > Trash
Properties of the trash:
- Once in the trash, an element will not appear in any other menu.
- Scheduling is stopped for all jobs in the trash.
- Deleting a report design or scheduled job does not cause any linked PDF reports to be deleted.
Items can be restored or permanently deleted through this menu:

Search filters
The following search filters allow you to search for an item in the trash:
- "Search", filter by element name
- "Object type", filter by element type
