Available reports
We have included a set of generic reports that you can reconfigure for your environment based on Centreon concepts (e.g., business activities, host groups and categories, service categories, metrics).
You can have a look at our Reports book to find the report you need before consulting this report guide.
Most of these reports have been designed to be perfectly rendered in PDF. The space reserved for object names (host, services, groups, categories) in tables or graph legends may sometimes be limited, so please remember to define object names accordingly.
Directly access the area you want to have a look at:
- Business activity monitoring
- Availability & Events
- Performance
- Storage
- Network
- Virtualization
- Electric consumption
- Profiling
- Inventory & Configuration
- Centreon/Reporting Database diagnostic
To incorporate your own logos into reports (when adequate space is provided), upload them to Centreon MBI using the interface. All images, regardless of their size, must have a 4:4 ratio to fit perfectly into the image areas.
Business Activity Monitoring
BV-BA-Availabilities-1
Description
This report displays statistics about application availability and events for a business view. It is generated using the default reporting time period for each business activity configured in the Centreon BAM module.
How to interpret the report
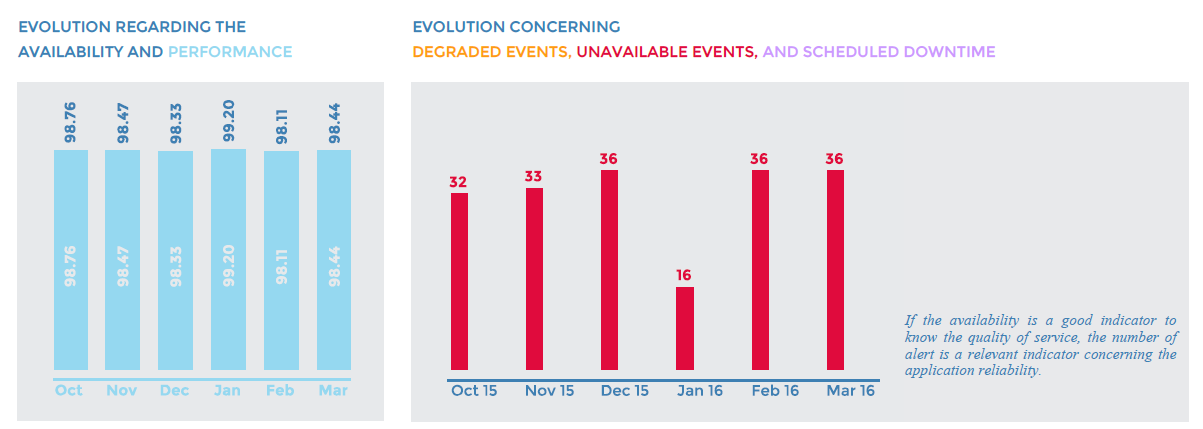
The first page presents a focus on the following attributes:
- Availability
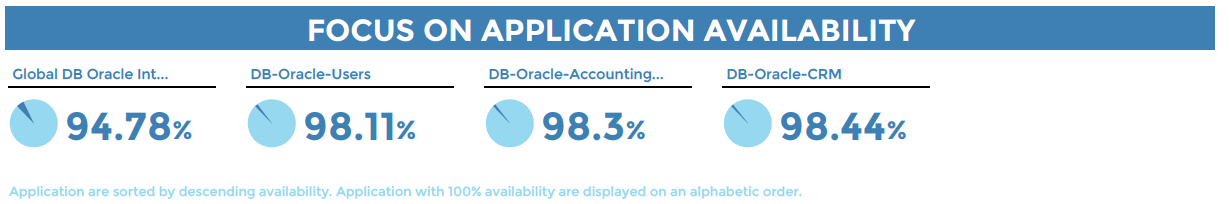
- Unavailability
The weather icons change according to the SLAs defined in each business activity, in terms of minutes.
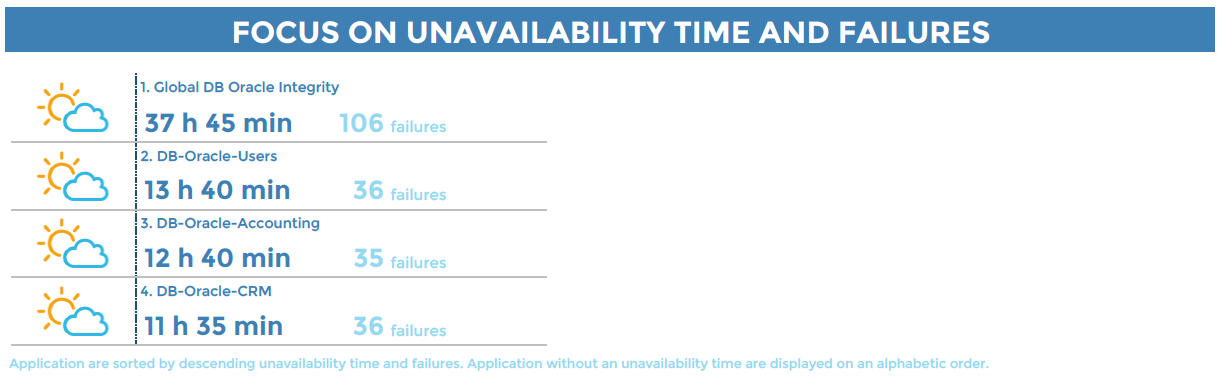
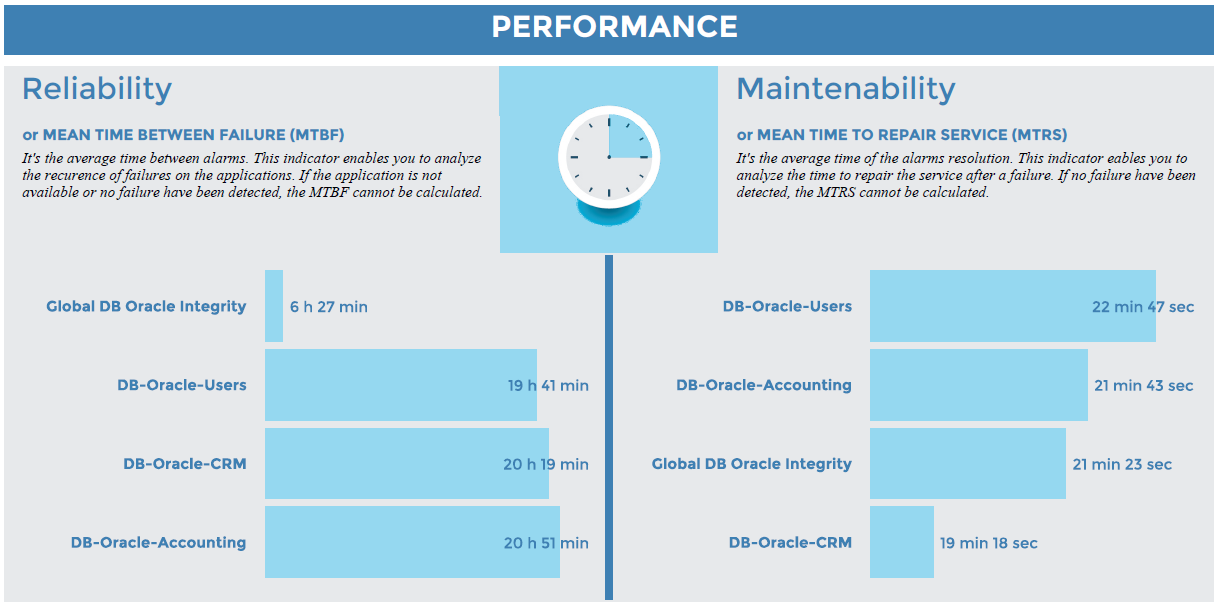
- Reliability and Maintainability
The following pages display additional statistics for each business activity in the business view:
- Availability, unavailability, downtime, service performance index and number of events that occurred.
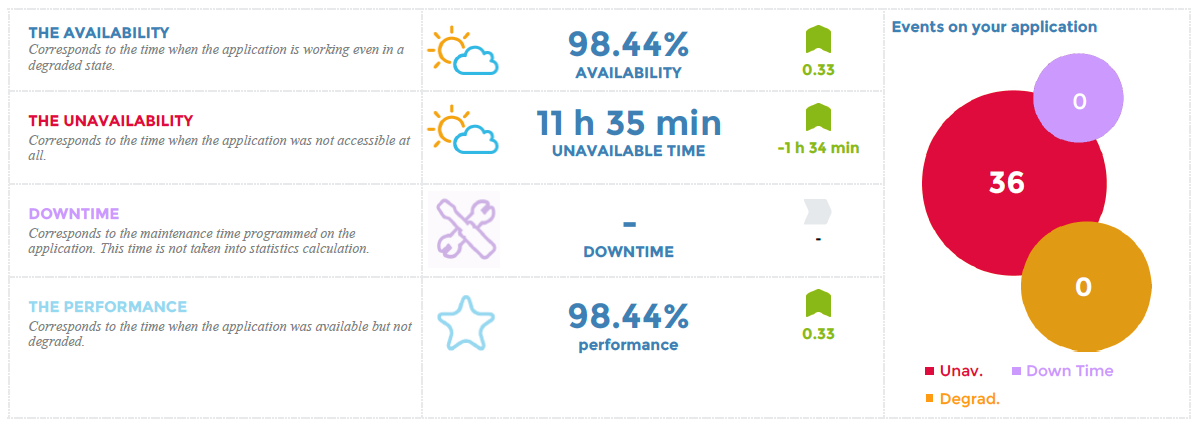
The weather icons change according to the SLAs defined in each business activity, in terms of percentages and minutes.
- Change in availability, performance and number of events.
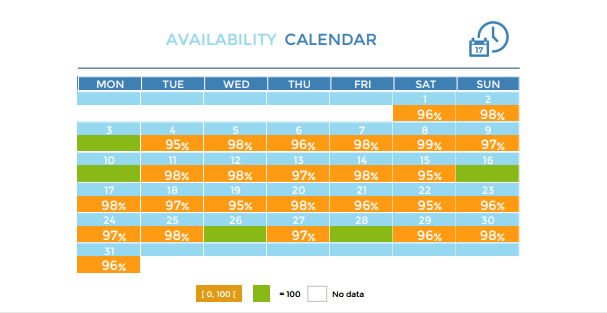
- An availability calendar displays only days when availability was below 100%.
- For days with 100% availability, the cell background color appears in a light gray with no values displayed.
- If data are not present on a specific day, the cell background color appears in white with no values displayed.
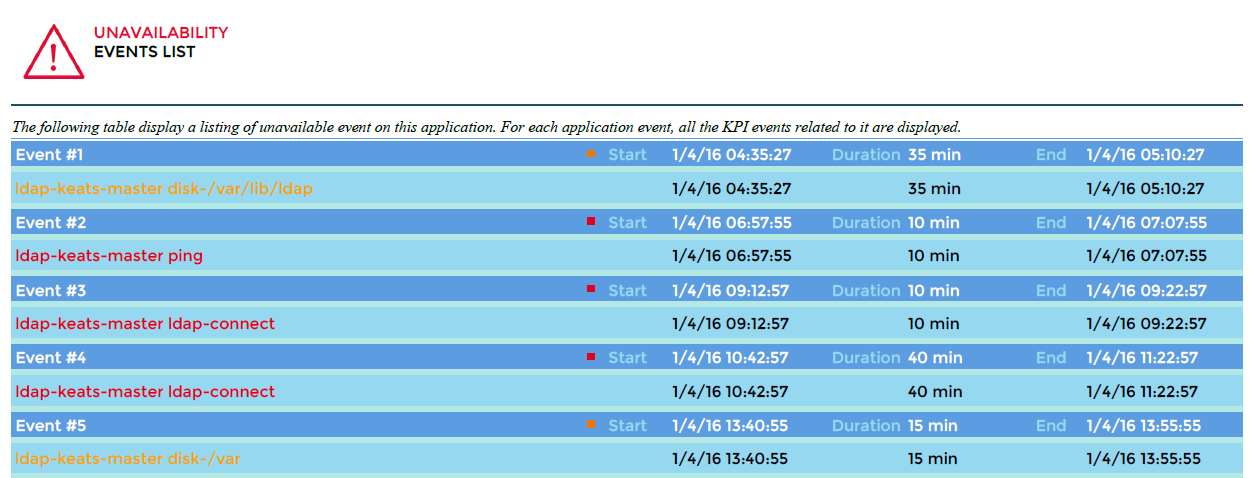
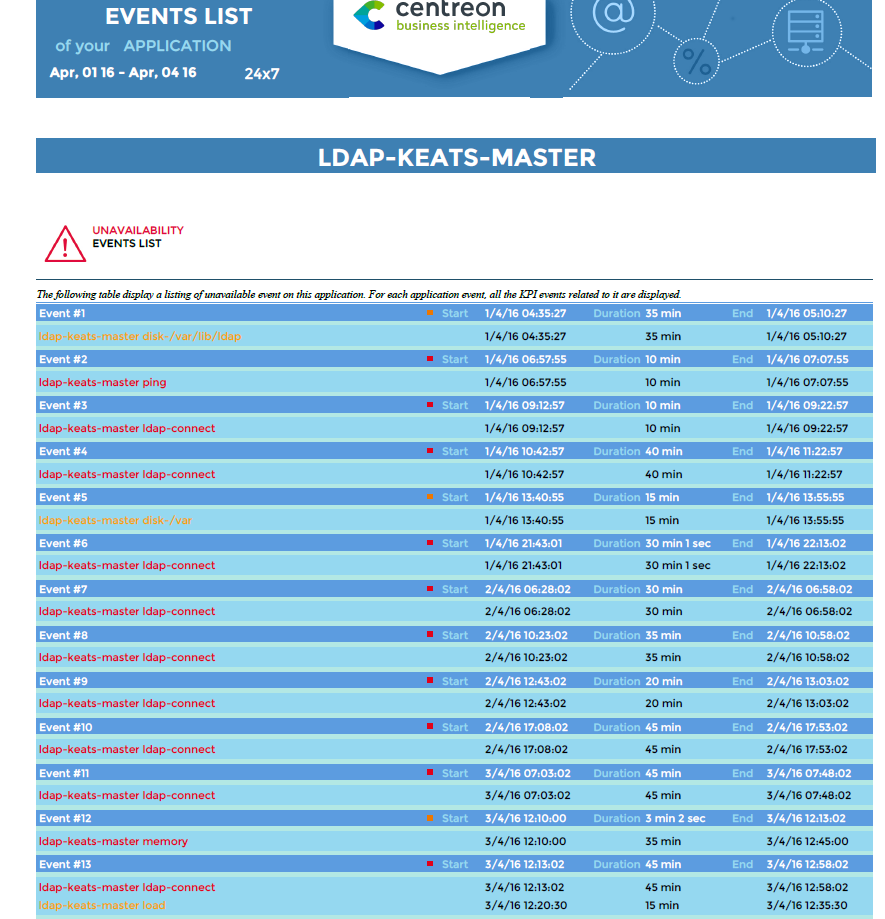
- As an option, the list of events appears with their respective key performance indicators (KPIs).
Parameters
Parameters required for the report:
- Start date representing the month in which you want to generate the report (matching the start date in the Centreon MBI interface)
- The following Centreon objects:
| Parameter | Type | Description |
|---|---|---|
| logo | Dropdown list | Select logo to display in header. |
| Business View | Dropdown list | Select a Business View for generating the report. |
| hide event | Radio button | Hide events list in the Business activity. |
| calendar color | Radio button | Color the calendar in green/orange/red based on SLA. |
| title | Text field | Specify report title. |
| time period | Dropdown list | Specify reporting time period.* |
* If different from "Default", be sure that the selected time period is defined as a Default or Extra reporting time period in the BA configuration or it will not appear in the report.
In the Time period field, do not use time periods that include exceptions, as the exceptions will not not be taken into account.
Prerequisites
- Monitoring of at least one business activity to be linked to one business view
- One month minimum of data from Centreon BAM module.
BA-Availability-1
This report displays statistics about business activity availability and events.
How to interpret the report
The following information is displayed on the report for the selected business activity:
- Availability, unavailability, downtime, service performance index and number of events.
The weather icons change according to the SLAs defined in each business activity, in terms of percentages and minutes.
- Change in the availability, performance and number of events
- An availability calendar displays only the days when availability was below SLA in terms of percentage defined in the business activity configuration.
- As an option, the list of events appears with their respective key performance indicators (KPIs).
Parameters
Parameters required for the report:
- Start date representing the month in which you want to generate the report (matching the start date in the Centreon MBI interface)
- The following Centreon objects:
| Parameter | Type | Description |
|---|---|---|
| logo | Dropdown list | Select logo to display in header. |
| Business Activity | Dropdown list | Select a Business Activity for generating the report. |
| hide event | Radio button | Hide events list in the business activity. |
| calendar color | Radio button | Color the calendar in green/orange/red based on SLA. |
| title | text field | Specify report title. |
| time period - Dropdown | Specify reporting time period.* |
* If different from "Default", be sure that the selected time period is defined as a Default or Extra reporting time period in the BA configuration.
In the Time period field, do not use time periods that include exceptions, as the exceptions will not not be taken into account.
BV-BA-Availabilities-List
Description
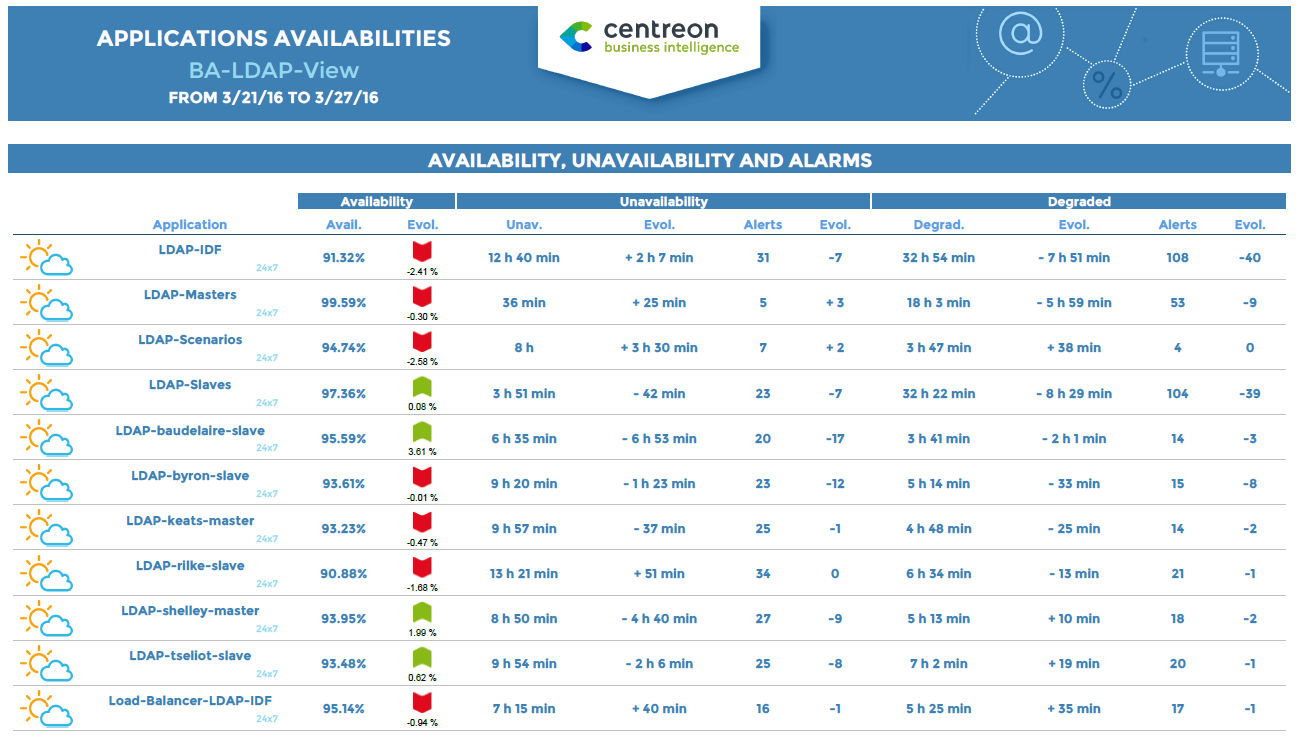
For a business view, this report lists statistics showing availability, unavailability, degraded service time and business activity alarms.
How to interpret the report
The weather icons change according to the SLA percentage defined in each business activity. If no SLA is defined, 100% availability will be represented by a sun icon, and all values below 100% by a cloud.
Changes are calculated in relation to the previous period:
- If the reporting period is a full month, the previous period is the previous full month.
- In all other cases, the change is calculated by the number of days preceding the number of days of the reporting period.
Parameters required for the report:
- Start date representing the month in which you want to generate the report (matching the start date in the Centreon MBI interface)
- The following Centreon objects:
| Parameter | Type | Description |
|---|---|---|
| logo | Dropdown list | Select logo to display in header. |
| Business View | Dropdown list | Select a Business View for generating the report. |
| hide event | Radio button | Hide events list in the Business activity. |
| calendar color | Radio button | Color the calendar in green/orange/red based on SLA. |
| title | Text field | Specify report title. |
| time period | Dropdown list | Specify reporting time period.* |
* If different from "Default", be sure that the selected time period is defined as a Default or Extra reporting time period in the BA configuration or it will not appear in the report.
In the Time period field, do not use time periods that include exceptions, as the exceptions will not not be taken into account.
Prerequisites
- Monitoring of at least one business activity to be linked to one business view
BA-Event-List
This report displays a list of events that occurred for a business activity.
How to interpret the report
The report displays a list of events for a business activity during a given period and the related KPIs. The time period applied is the default value set in the configuration BA menu.
Parameters
| Parameter | Type | Description |
|---|---|---|
| logo | Dropdown list | Select logo to display in header. |
| Business Activity | Dropdown list | Select a Business Activity for generating the report. |
| hide event | Radio button | Hide events list in the business activity. |
| calendar color | Radio button | Color the calendar in green/orange/red based on SLA. |
| title | text field | Specify report title. |
| time period | Dropdown | Specify reporting time period.* |
* If different from "Default", be sure that the selected time period is defined as a Default or Extra reporting time period in the BA configuration.
In the Time period field, do not use time periods that include exceptions, as the exceptions will not not be taken into account.
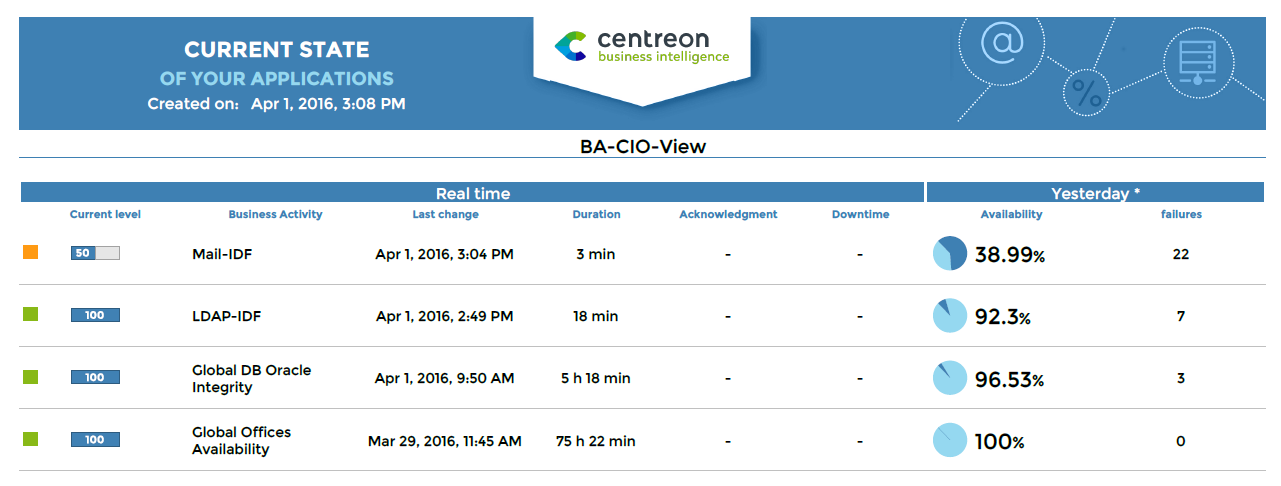
BV-BA-Current-Health-VS-Past
Description
This report displays the current health of business activities at the time the report is generated. It also displays availability for a defined period.
How to interpret the report
For a given business view, the report displays the real-time health state of each business application, the hour of latest state change and duration of the current state. The report also indicates whether the application has been acknowledged or in downtime. Depending on the parameter selected, the report displays availability and failures for each application.
Parameters
Parameters required for the report:
| Parameters | Type | Description |
|---|---|---|
| logo | List box | Select logo to display in header. |
| title | Text field | Specify report title. |
| Business View | List box | Select a Business View for generating the report. |
| compare_with | Radio button | Display historical data according to specified period. |
| show the reporting timeperiod | Radio botton | Show or hide the default time period related to the business activity. |
| title | Text field | Specify report title. |
| time period | Dropdown list | Specify reporting time period or other.* |
* If different from "Default", be sure that the selected time period is defined as a Default or Extra reporting time period in the BA configuration or it will not appear in the report.
In the Time period field, do not use time periods that include exceptions, as the exceptions will not not be taken into account.
Prerequisites
- Monitoring of at least one business activity to be linked to one business view.
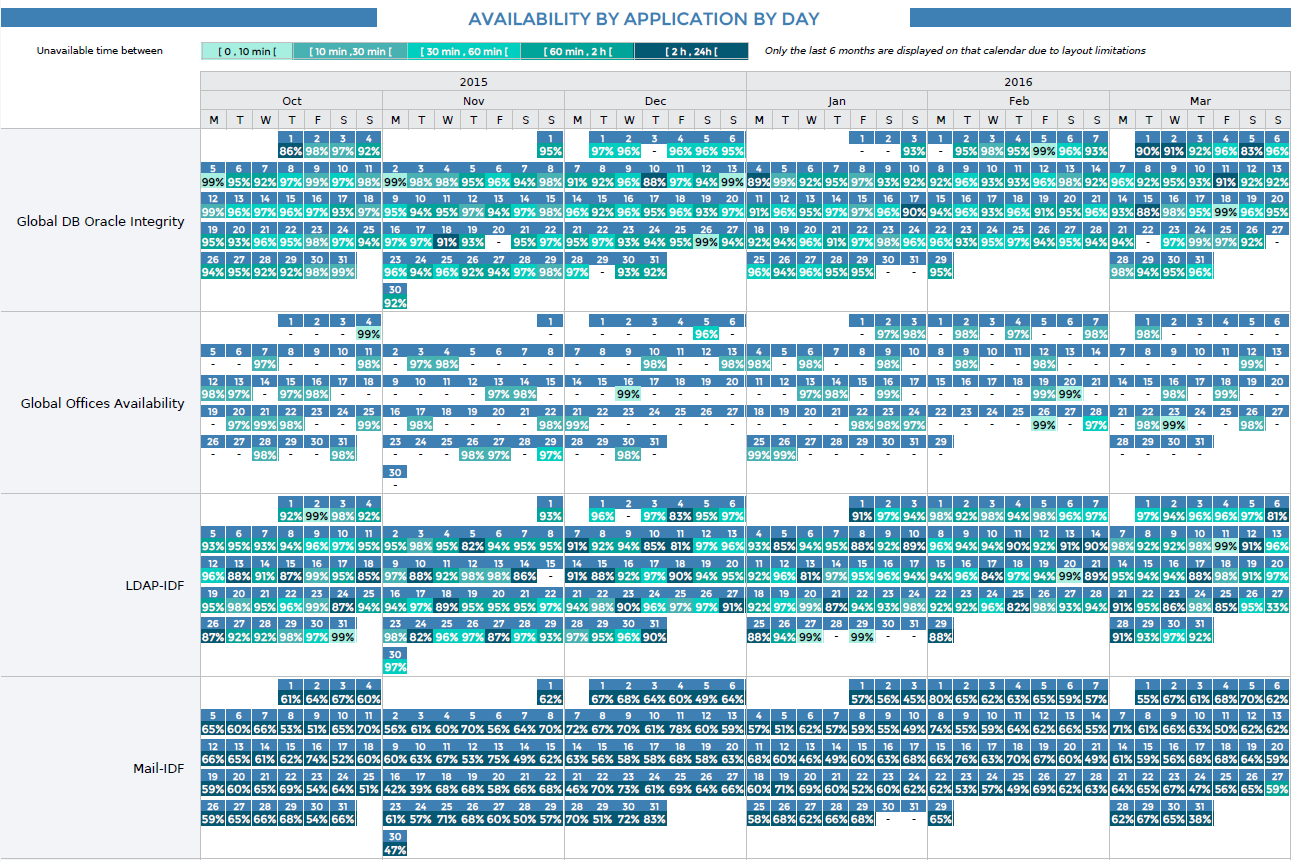
BV-BA-Availabilities-Calendars
Description
This report displays statistics about business activity availability and events. The statistics appear in calendars, by month and by day. This report is generated using the default reporting time period configured in the Centreon BAM module for each business activity.
How to interpret the report
The first calendar displays the availability of your business activities by month. Cells are colored according to the SLA defined for each business activity in percentages (in the Extended Information tab menu). If the SLAs are not defined in the BA configuration, values are displayed in cells if availability is below 100% or if unavailability > 0 seconds. The time period that applies is the "Default reporting period" selected for each business activity (in the Configuration tab menu).
The second calendar displays the unavailability and number of events for your business activities by month. Cells are colored according to the SLA defined for each business activity in minutes. If the SLAs are not defined in the BA configuration, values are displayed in cells if availability is below 100% or if unavailability > 0 seconds. The time period that applies is the "Default reporting period" selected for each business activity.
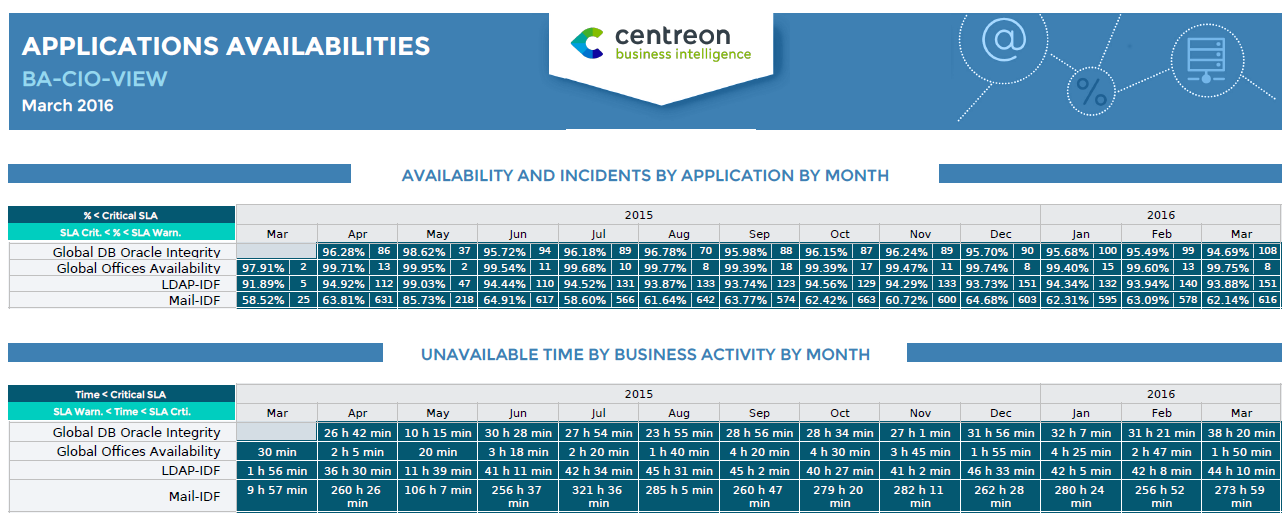
The third calendar displays availability for each business activity by day. Cells are colored according to time frames (in minutes) of unavailability, configured for the report. If unavailability is below 100%, availability is displayed for that day.
Parameters
Parameters required for the report:
- A start date corresponding to the month for which you want to generate the report (corresponding to the start date in the Centreon MBI interface)
- The following objects:
| Parameter | Type | Description |
|---|---|---|
| logo | Dropdown list | Select logo to display in header. |
| business View | Dropdown list | Select a Business View for generating the report. |
| sla 1* | Text field | Time in minutes corresponding to the high threshold of the first interval [0 min, sla1] |
| sla 2* | Text field | Time in minutes corresponding to the high threshold of the second interval [sla1, sla2] |
| sla 3* | Text field | Time in minutes corresponding to the high threshold of the third interval [sla2, sla3] |
| sla 4* | Text field | Time in minutes corresponding to the high threshold of the fourth interval [sla3, sla4] |
| title | Text field | Specify report title. |
| time period | Dropdown list | Specify reporting time period or a specific one.** |
* SLA thresholds appear above the calendar displaying availability by day.
![]()
* If different from "Default", be sure that the selected time period is defined as a Default or Extra reporting time period in the BA configuration or it will not appear in the report.
In the Time period field, do not use time periods that include exceptions, as the exceptions will not not be taken into account.
Prerequisites
- Monitoring of at least one business activity to be linked to one business view
- One month minimum of data from Centreon BAM extension.
Availability & Events
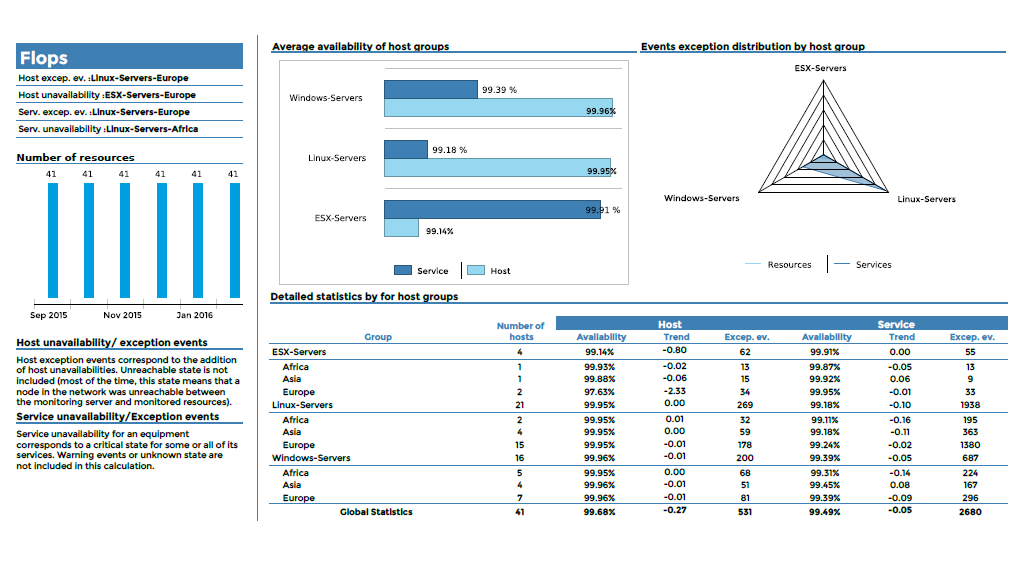
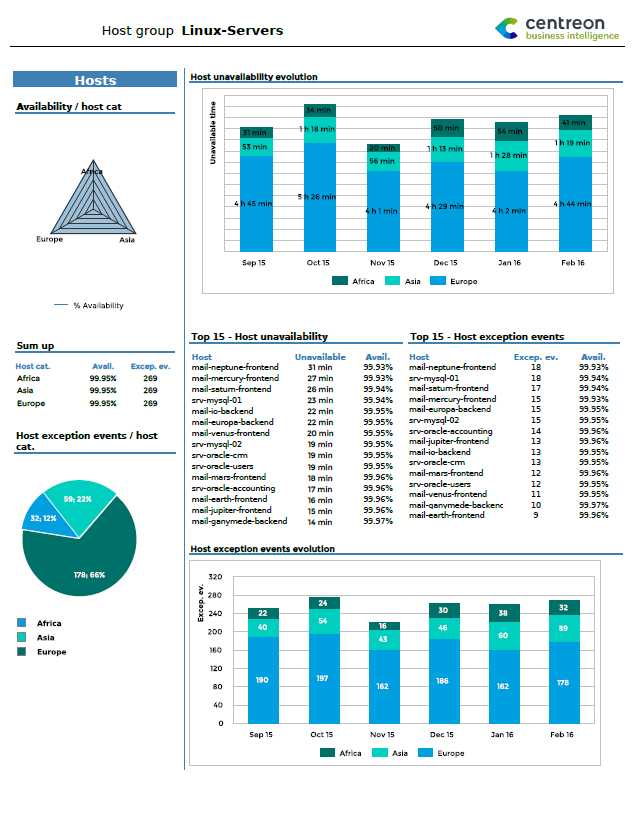
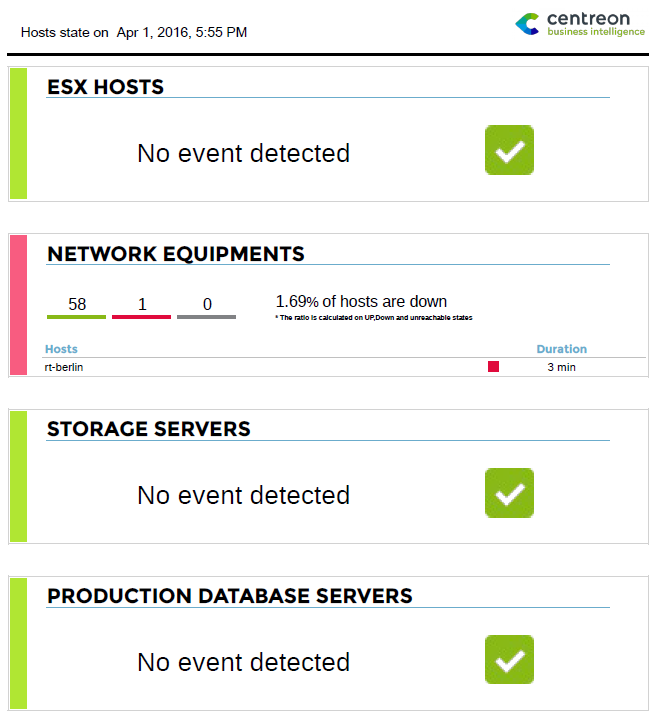
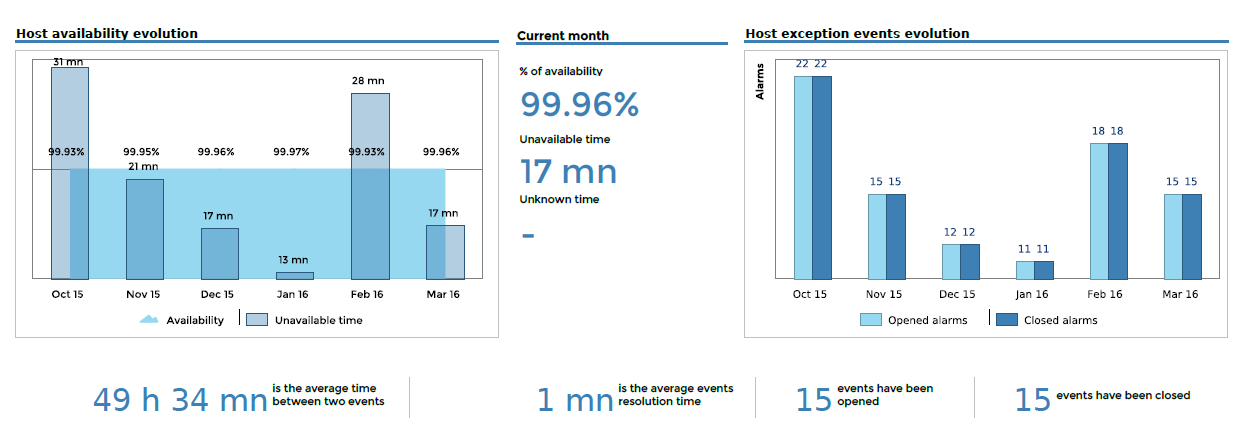
Hostgroups-Incidents-1
Description
This report provides an overview of host exception events and unavailability.
How to interpret the report
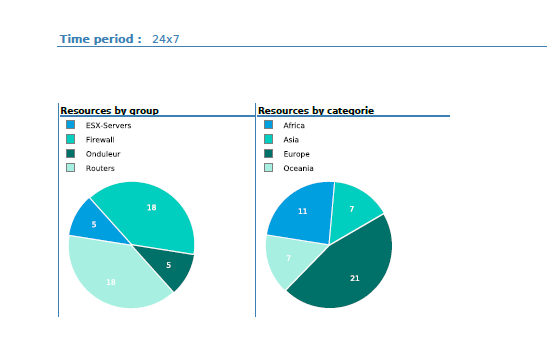
On the cover sheet, two pie charts show the number of hosts by host groups and host categories.
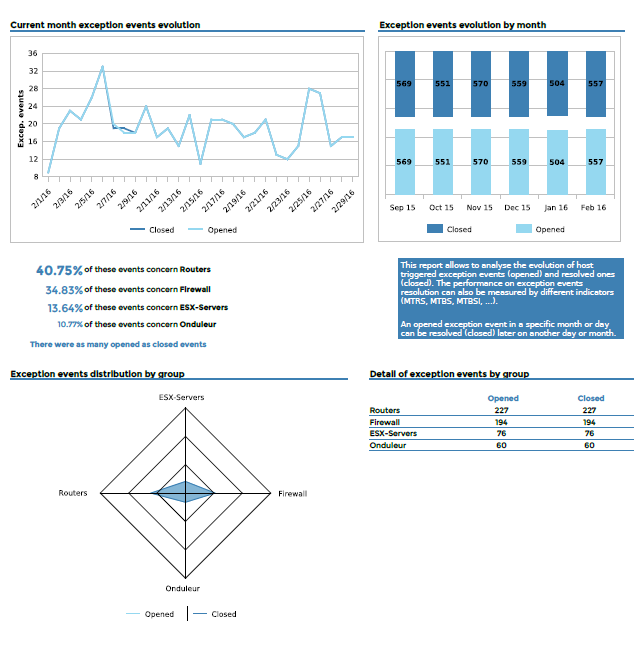
On the first page, the graphs show the evolution of exception events by day and by month. A radar graph provides the exception event distribution by host groups.
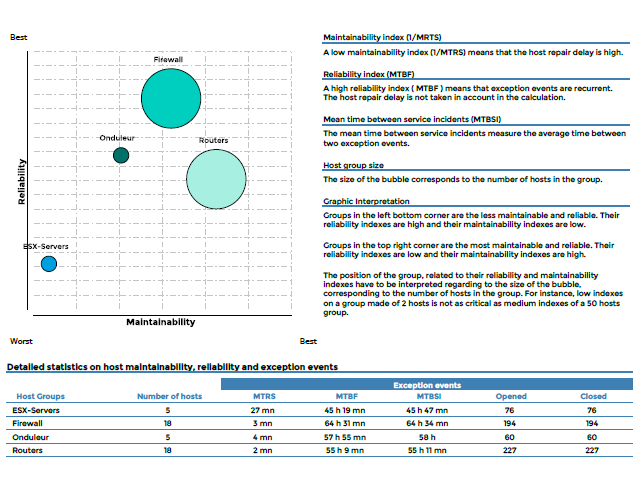
On the second page, the graph shows the maintainability and reliability of the host groups, as determined by an index based on MTRS and MTBF times.
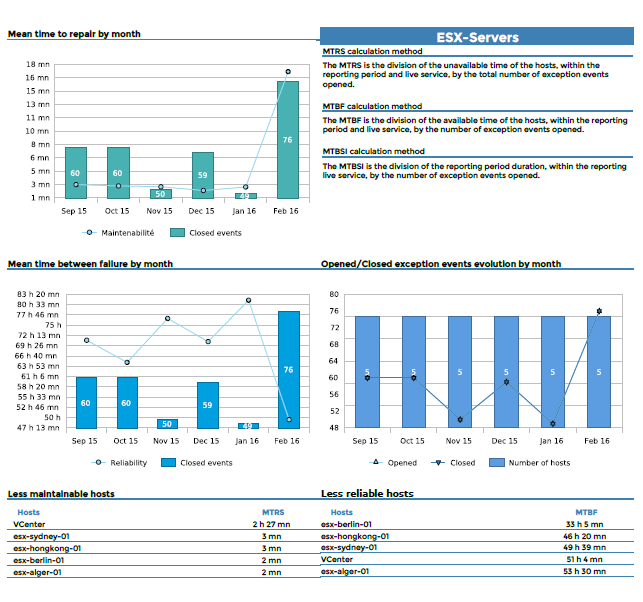
Afterwards, a series of bar charts present information by host group, showing the evolution of exception events by host type. Finally, there is a comparison of the least maintainable and reliable host for each host group.
Cover sheet
First page
Second page
For each host group
Parameters
Parameters required for the report:
- The reporting period.
- The following Centreon objects:
| Parameter | Parameter type | Description |
|---|---|---|
| Hostgroups | Multi selection | Select host groups. |
| Host Categories | Multi selection | Select host categories. |
| Time period | Dropdown list | Specify time period. |
| Interval | Text field | Specify no. of months in trend graphs. |
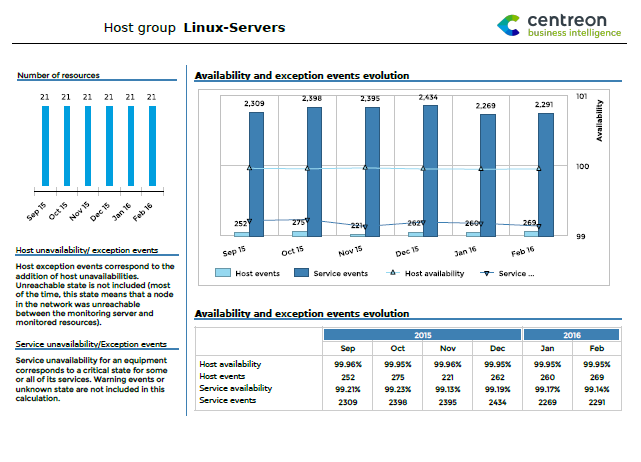
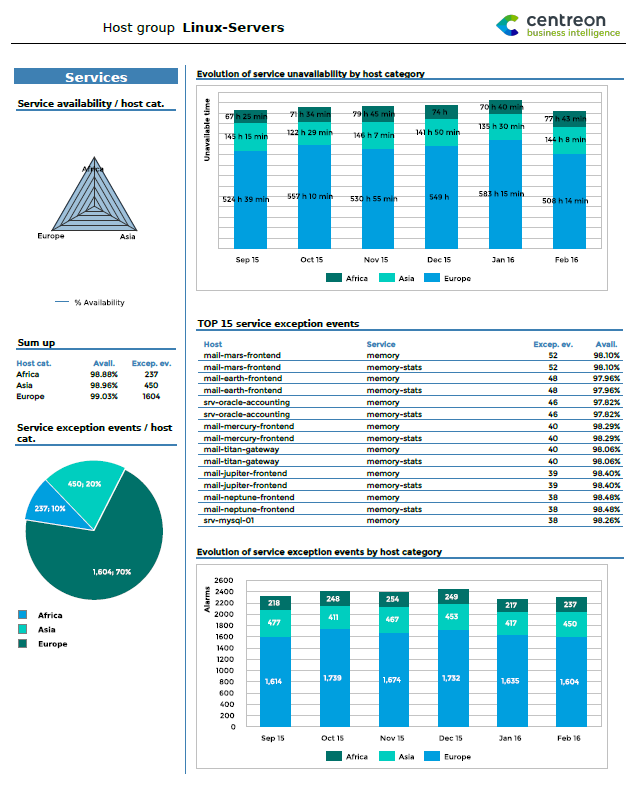
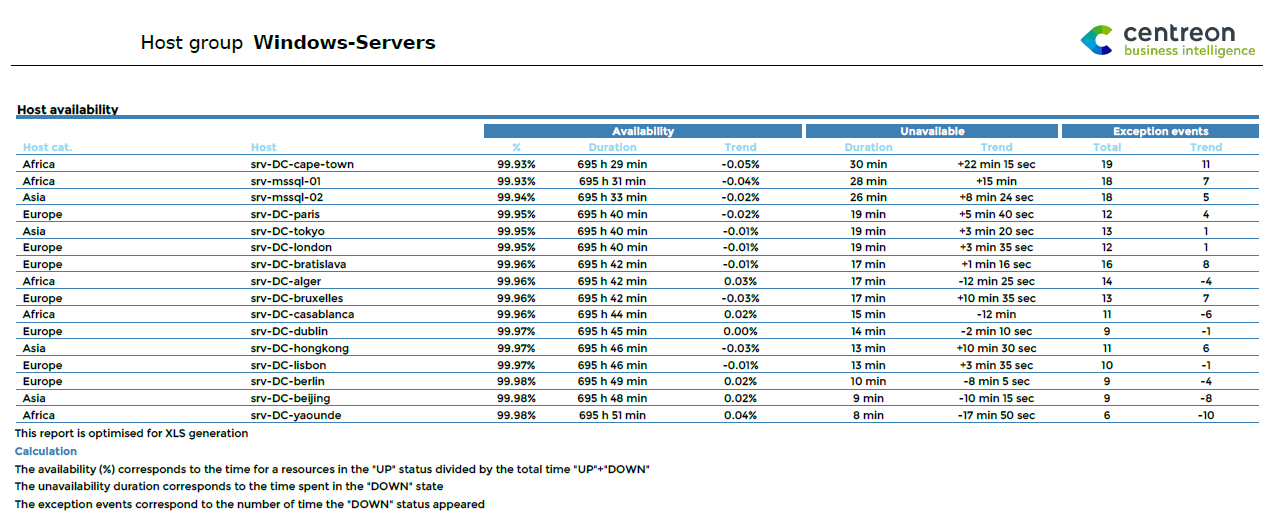
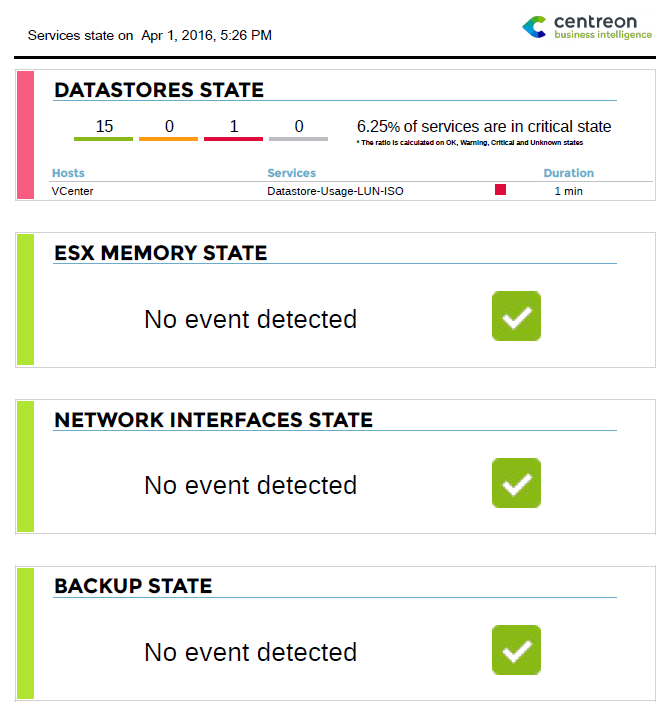
Hostgroups-Availability-1
Description
This report shows availability, exception-type events for hosts and services of multiple host groups. It also shows the evolution of the hosts for each host group, the evolution of availability and number of exception events for hosts and services.
How to interpret the report
On the first page, the report displays a graph of the host and service availability for hostgroups, exception-events distribution, evolution of the number of resources, and a cross table detailing the statistics for all the previous information.
On the following pages, evolution of the unavailability and exception events is detailed for each host group, sorted by host categories and service categories.
Finally, host and service statistics are displayed with the top-most unavailability and exception events.
First page
For each host group
First page
Second page
Parameters
Parameters required for the report:
- The reporting period
- The following Centreon objects:
| Parameter | Parameter type | Description |
|---|---|---|
| Hostgroups | Multi selection | Select host groups. |
| Host Categories | Multi selection | Select host categories. |
| Service Categories | Multi selection | Select service categories. |
| Time period | Dropdown list | Specify time period. |
| Interval | Text field | Specify no. of months in trend graphs. |
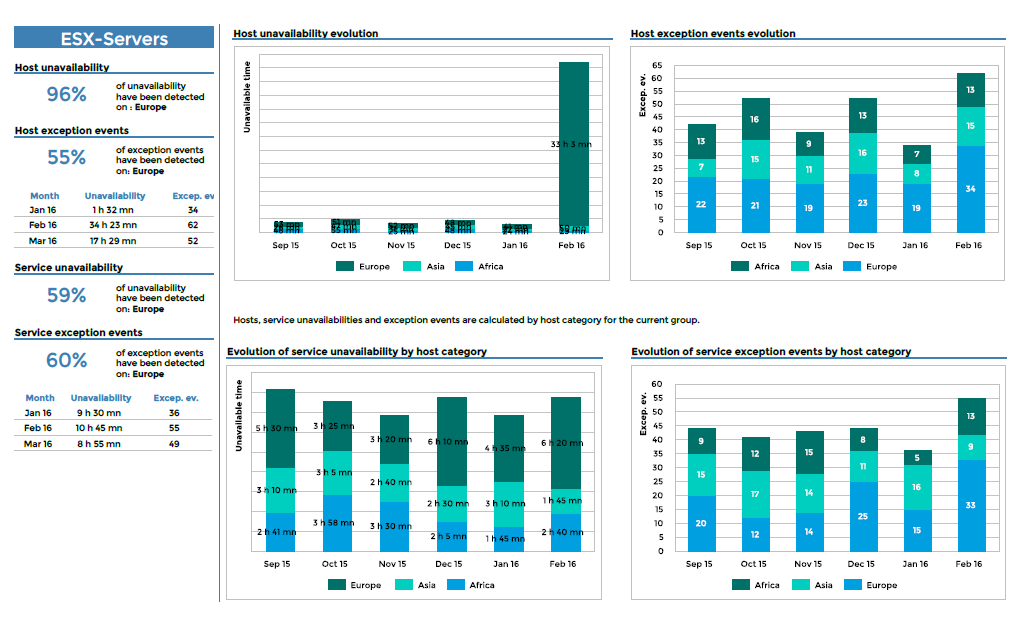
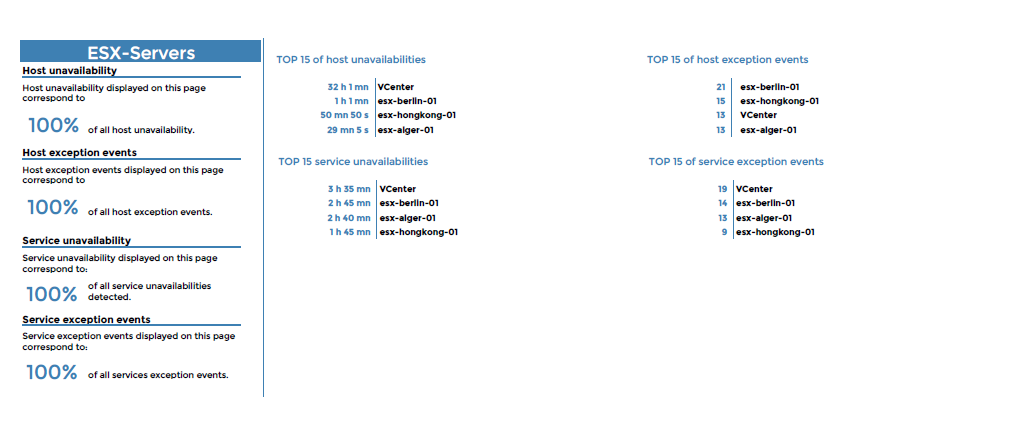
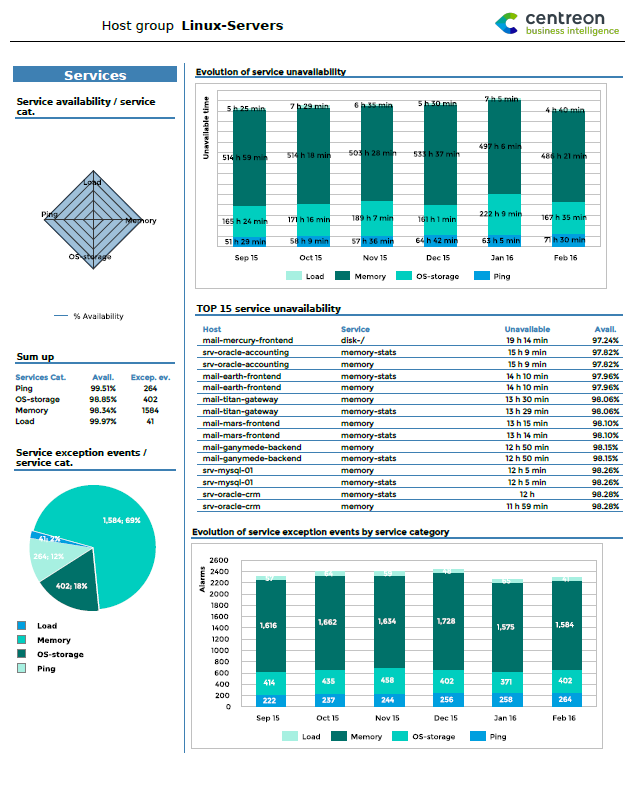
Hostgroup-Availability-2
Description
This report displays information about availability and exception events for a host group.
How to interpret the report
On the first page, the evolution of availability and exception events is displayed for hosts and services. The evolution of host group resources is also shown.
On the second page, statistics are shown for detailed availability and exception events on a host according to category. A table lists the hosts that were least available and that created the largest number of exception events.
On the two last pages, detailed statistics for indicators on availability and exception events are shown. The information is organized by host and service category. The top 15 hosts are listed in terms of service unavailability and exception events.
First page
Second page
Third & Fourth pages
and
Parameters
Parameters required for the report:
- Reporting period
- The following Centreon objects:
| Parameter | Parameter type | Description |
|---|---|---|
| Host group | Drop-downlist | Select host group. |
| Host Categories | Multi select | Select host categories. |
| Services Categories | Multi select | Select host categories. |
| Time period | Dropdown list | Time period to report. Note: Only use the time period from the ETL month properties. |
| Evolution interval | Text field | Specify no. of months of history for the evolution graph |
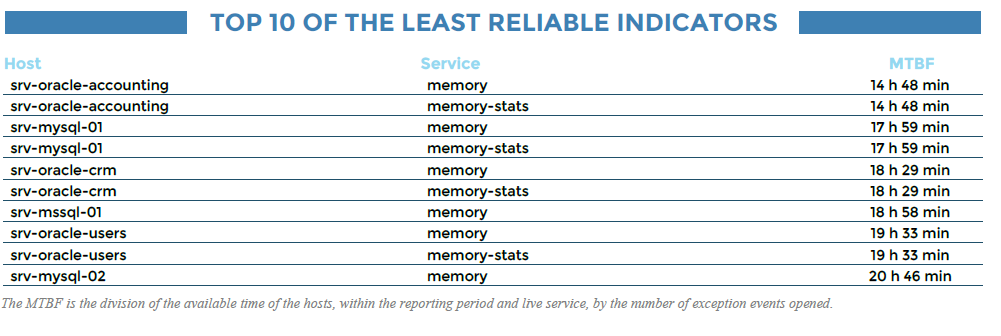
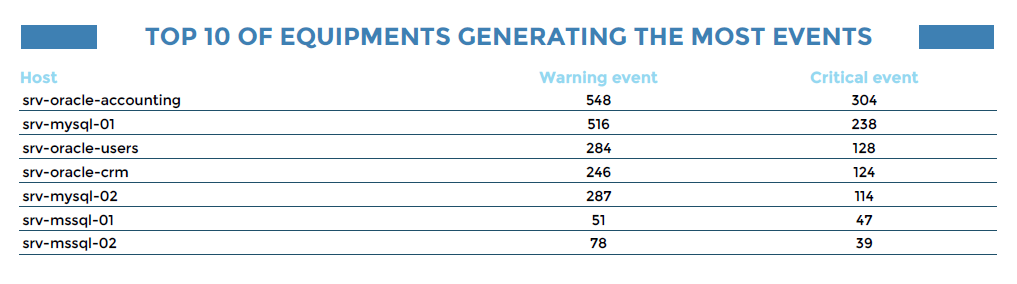
Hostgroup-Service-Incident-Resolution-2
Description
This report displays the rate of acknowledged and resolved events, the longest-lasting events, the least reliable indicators, and hosts generating the most events for a given host group.
How to interpret the report
The first graph displays the rate of acknowledged and resolved events within a specific time frame.
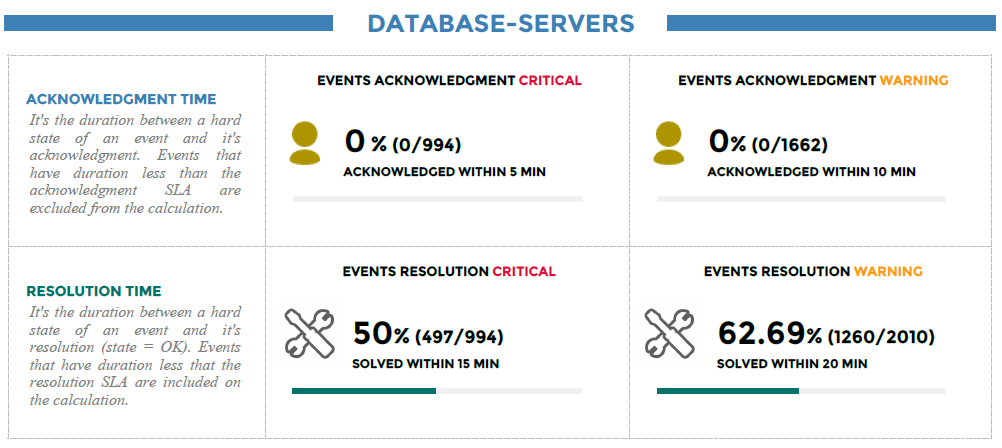
The second graph displays the top 10 longest events with the start, end and resolution time.
Indicators in a critical-state appear in red, in a warning-state in orange, and an unknown state in gray.
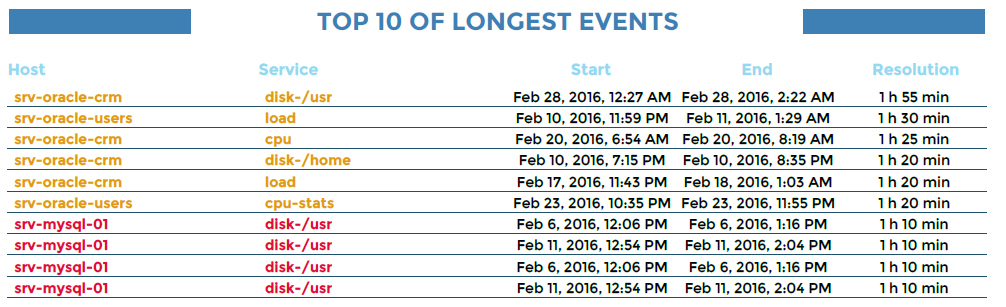
The third graph in the report displays the top 10 the least reliable indicators.
Finally, the top 10 hosts generating the most events.
Parameters
Parameters required for the report:
- Reporting period
- SLA of acknowledgment in minutes
- SLA of resolution in minutes
- The number of rows to display in top objects
- The following Centreon objects:
| Parameter | Parameter type | Description |
|---|---|---|
| Hostgroups | Multi selection | Select host groups. |
| Host Categories | Multi selection | Select host categories. |
| Service Categories | Multi selection | Select service categories. |
| Time period | Dropdown list | Specify time period. |
Hostgroup-Host-Availability-List
Description
This report displays information on availability and exception events for hosts within a hostgroup.
How to interpret the report
For each host, the table lists the percentage of availability, unavailability and number of exception events and trends.
This report is optimized for generating XLS files.
Parameters
Parameters required for the report:
- Reporting period
- The following Centreon objects:
| Parameter | Parameter type | Description |
|---|---|---|
| Host group | Drop-down list | Select host group. |
| Hosts Categories | Multi select | Select host categories |
| Time period | Drop-down list | Specify time period |
Hostgroup-Host-Event-List
Description
This report provides a list of exception events for hosts.
How to interpret the report
The table contains detailed statistics on critical or warning-type exception events on hosts indicating start, acknowledgment and end dates. The report also calculates the real and the effective MTRS for each event.
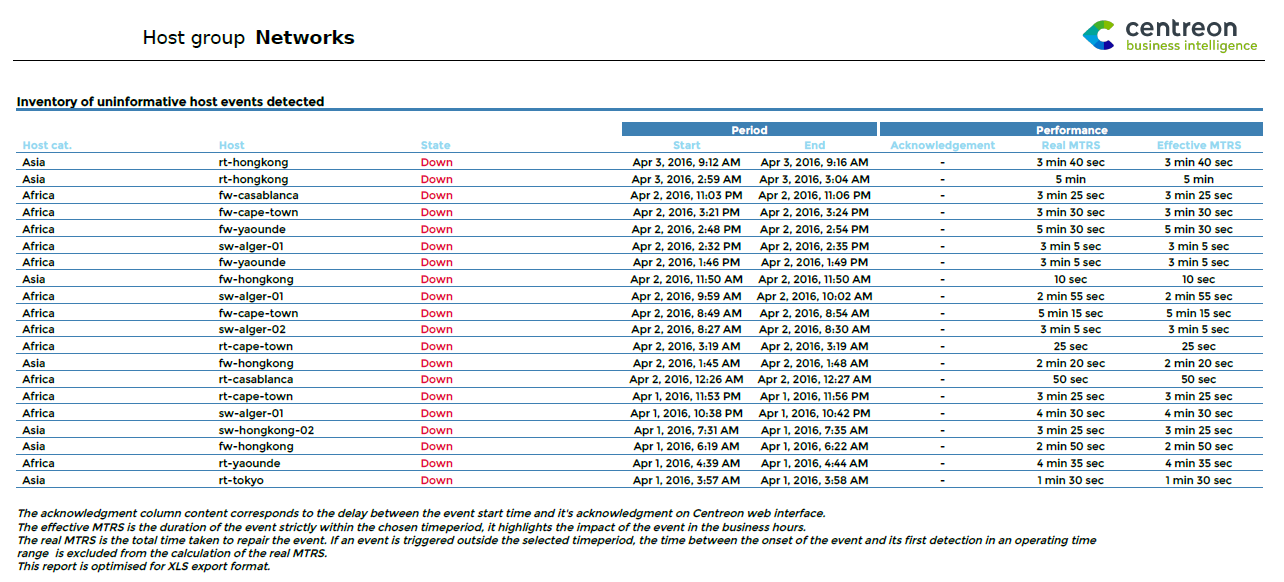
This report is optimized for generating XLS files.
Parameters
Parameters required for the report:
- Reporting period
- The following Centreon objects:
| Parameter | Parameter type | Description |
|---|---|---|
| Host group | Drop-down list | Select host group. |
| Hosts Categories | Multi select | Select host categories. |
| Time period | Drop-down list | Specifiy time period |
Hostgroup-Service-Availability-List
Description
This report displays events and the availability of services for a host group.
How to interpret the report
For each service, detailed statistics are provided: availability (in percentage), unavailability, exception and warning events, as well as the trends for these various indicators.
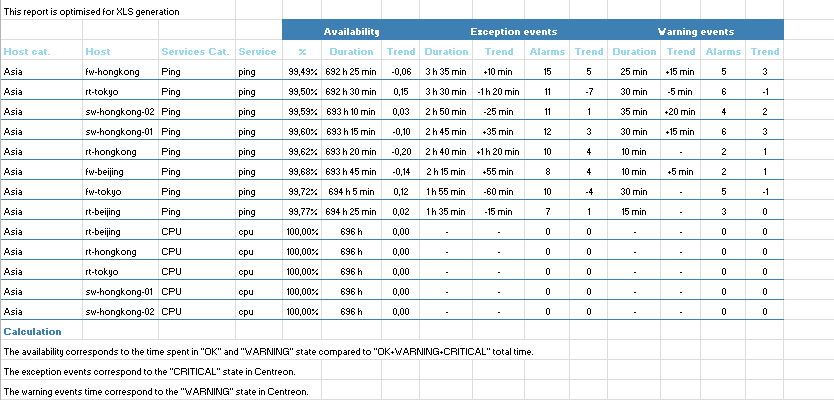
This report is optimized for generating XLS files.
Parameters
Parameters required for the report:
- The reporting period
- The following Centreon objects:
| Parameter | Parameter type | Description |
|---|---|---|
| Hostgroup | Drop-down list | Select host group. |
| Host Categories | Multi selection | Select host categories. |
| Service Categories | Multi selection | Select service categories. |
| Time period | Dropdown list | Specify time period. |
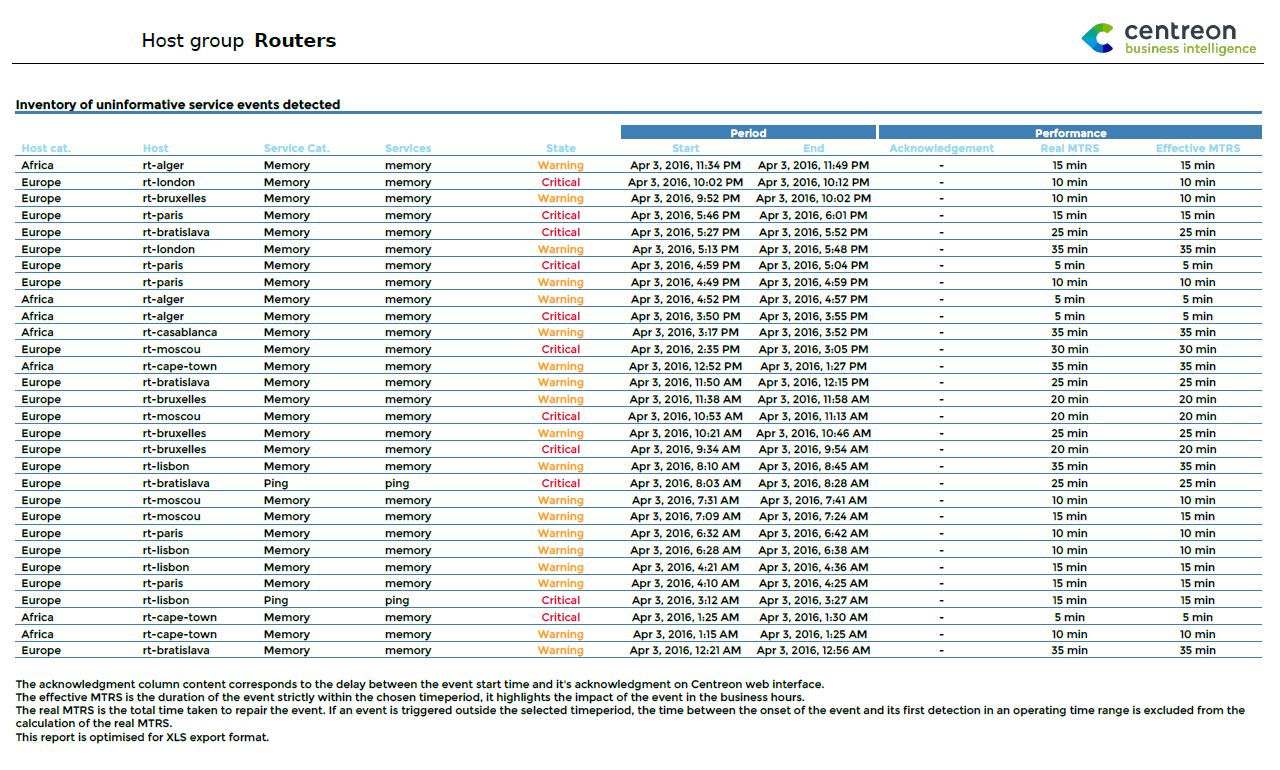
Hostgroup-Service-Event-List
Description
This report displays a table listing critical or warning-type events for services in a hostgroup.
How to interpret the report
The report also calculates the real and the effective MTRS for each alarm. A table contains detailed statistics on events occurring on hosts indicating start, acknowledgment and end dates.
Parameters
Parameters required for the report:
- Reporting period
- The following Centreon objects:
| Parameter | Parameter type | Description |
|---|---|---|
| Hostgroup | Drop-down list | Select host group. |
| Host Categories | Multi selection | Select host categories. |
| Service Categories | Multi selection | Select service categories. |
| Time period | Dropdown list | Specify time period. |
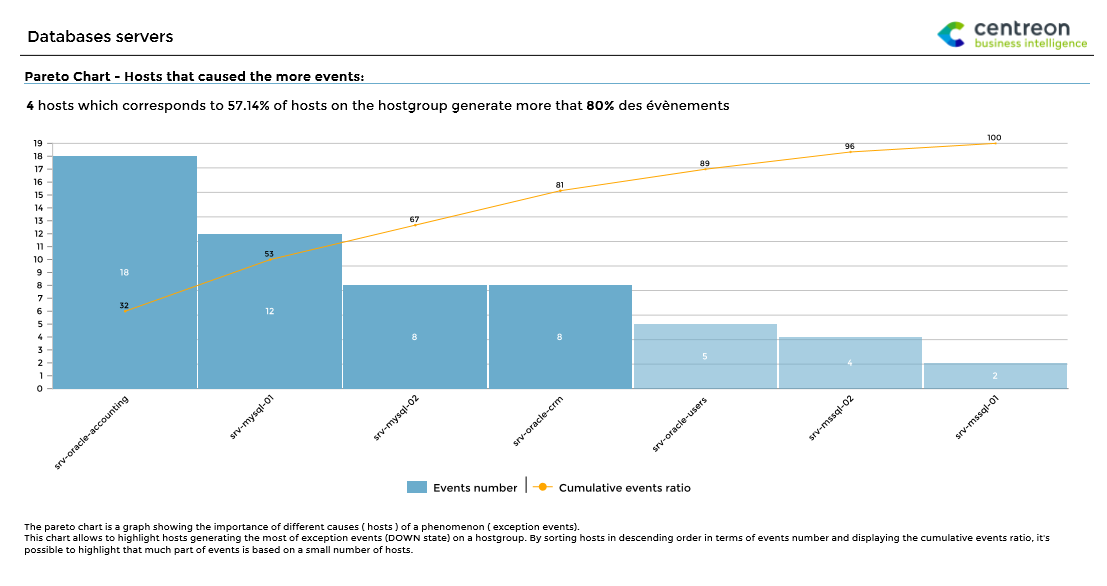
Hostgroup-Host-Pareto
Description
This report allows you to identify hosts responsible for the largest number of exception events in a host group. The data is represented in a Pareto chart.
How to interpret the report
Hosts responsible for 80% of events are highlighted. Hosts are sorted in descending order in terms of number of generated events. The ratio of cumulative events is also shown.
This report helps you to focus on the most problematic hosts by applying the Pareto principle (or 80-20 rule): approximately 80% of the effects come from 20% of the causes.
Parameters
Parameters required for the report:
- Reporting period
- The following Centreon objects:
| Parameter | Parameter type | Description |
|---|---|---|
| Hostgroup | Drop-down list | Select host group. |
| Host Categories | Multi selection | Select host categories. |
| Time period | Dropdown list | Specify time period. |
Hostgroups-Host-Current-Events
Description
This report displays the events occurring on hosts at the time it is generated.
How to interpret the report
The report consists of four parts. On each part, you can use a filter to select a restricted perimeter for host groups and host categories. Data is displayed with real-time results when the report is generated. In addition:
- Events can be sorted by state, duration or hostname.
- You can display and/or filter acknowledged hosts or hosts in downtime.
- Only confirmed events (hard state) are taken in account.
- A report can have fewer than four parts by specifying the value -1 in its title.
Parameters
Parameters required for the report:
| Parameters | Type | Description |
|---|---|---|
| Title | Text field | Specify the title for part 1 of report. |
| Hostgroups | Multi select | Select host groups for part 1 of report. |
| Host category | Multi select | Select host categories for part 2 of report. |
| Title | Text field | Specify title for part 2 of report. |
| Hostgroups | Multi select | Select host groups for part 2 of report. |
| Host category | Multi select | Specify host categories for part 2 of report. |
| Title | Text field | Specify title for part 3 of report. |
| Hostgroups | Multi Select | Select host groups to use for part 3 of report. |
| Host category | Multi select | Select host categories for part 3 of report. |
| Title | Text field | Specify title for part 4 of report. |
| Hostgroups | Multi select | Specify host groups for part 4 of report. |
| Host category | Multi select | Select host categories for part 4 of report. |
| sort_by | Radio button | Sort results by state, duration or host name. |
| display_ack | Radio button | Display or filter acknowledged hosts. |
| display_downtime | Radio button | Display or filter hosts in downtime. |
Hostgroups-Service-Current-Events
Description
This report displays the events occurring with services at the time it is generated.
How to interpret the report
This report consists of four parts. On each part, you can use a filter to select a restricted perimeter for host groups, host categories and service categories. Data is displayed with real-time results when the report is generated. In addition:
- Events can be sorted by state, duration or hostname.
- You can display and/or filter acknowledged hosts or hosts in downtime.
- Only confirmed events (hard state) are taken in account.
- A report can have fewer than four parts by specifying the value -1 in its title.
Parameters
Parameters required by the report:
| Parameters | Type | Description |
|---|---|---|
| title | Text field | Specify title for part 1 of report. |
| Hostgroups | Multi select | Select host groups for part 1 of report. |
| Host category | Multi select | Select host categories for part 2 of report. |
| Service category | Multi select | Select service categories for part 1 of report. |
| title | Text field | Specify title for part 2 of report. |
| Hostgroups | Multi select | Select host groups for part 2 of report. |
| Host category | Multi select | Select host categories for part 2 of report. |
| Service category | Multi select | Select service categories for part 2 of report. |
| title | Text field | Specify title for part 3 of report. |
| Hostgroups | Multi Select | Select host groups for part 3 of report. |
| Host category | Multi select | Select host categories for part 3 of report. |
| Service category | Multi select | Select service categories for part 3 of report. |
| title | Text field | Specify title for part 4 of report. |
| Hostgroups | Multi select | Select host groups for part 4 of report. |
| Host category | Multi select | Select host categories for part 4 of report. |
| Service category | Multi select | Select service categories for part 4 of report. |
| sort_by | Radio button | Sort results by state, duration or hostname. |
| display_ack | Radio button | Display or filter acknowledged hosts. |
| display_downtimes | Radio button | Display or filter hosts in downtime. |
| display_only_critical | Radio button | Display only services in critical state. |
Performance
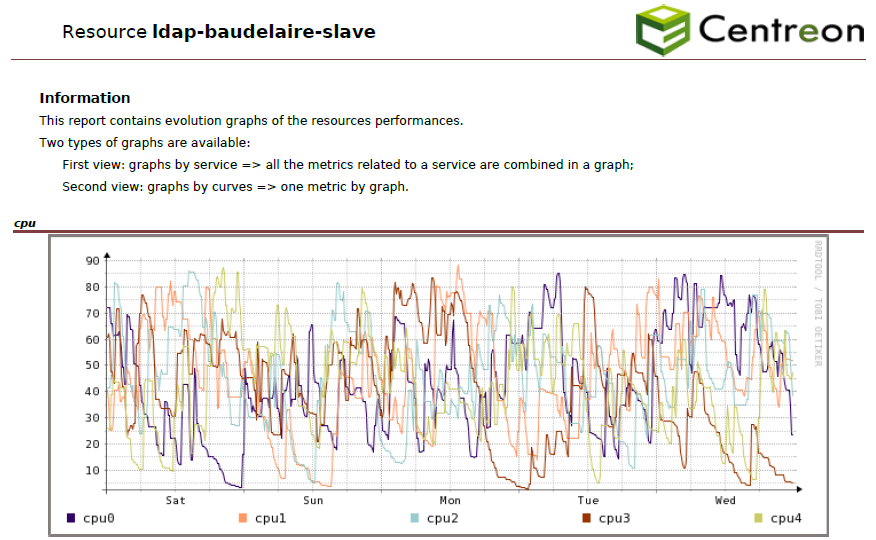
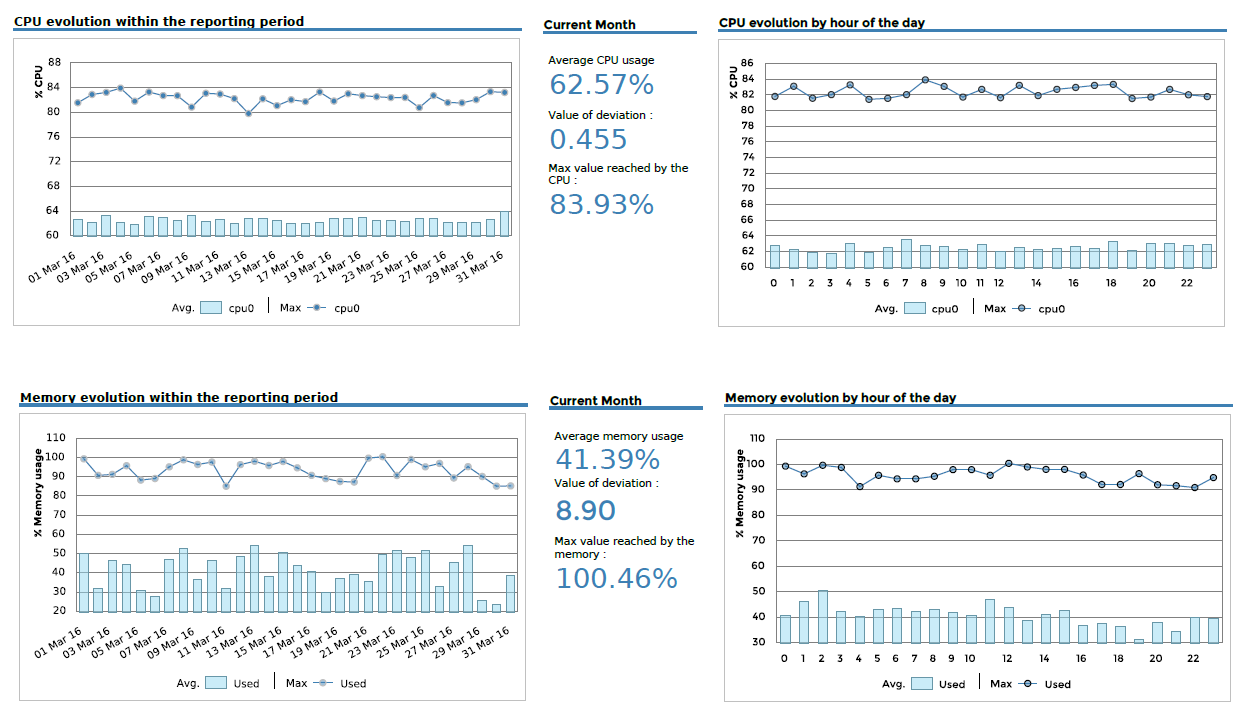
Host-Graphs-V2
Description
This report presents round-robin database (RRD) graphs for the evolution and performance of Centreon services over a defined period.
Parameters
Parameters required for the report:
- Reporting period
- The following Centreon objects:
| Parameter | Parameter type | Description |
|---|---|---|
| Host | Selection | Select host. |
| Service Categories | Multi select | Select service category. |
| Metrics | Multi select | Metrics to use. If no metric is selected, graphs by metric will not displayed. |
| Graphs display rule | Check box | Sets whether you want to see all the metrics on one graph for each service, one graph per metric, or both. |
Prerequisites
Go to Reporting > Business Intelligence > General Options > Scheduler Options and configure the following field:
![]()
In order to export RRD graphs using the Centreon API, the reporting server needs to access it using HTTP or HTTPS protocol. A curl command sent to the URL of the API should generate an image file.
curl http://$CENTREON-IP-OR-DNS$/centreon/include/views/graphs/generateGraphs/generateImage.php?akey=$AUTH_KEY$&username=$USER$&hostname=$HOSTNAME$&service=$SERVICENAME$&start=$TIMESTAMPSTART$&end=$TIMESTAMPEND$
Replace the values between $ signs with real values.
Example:
curl http://centreon.enterprise.com/centreon/include/views/graphs/generateGraphs/generateImage.php?akey=af9c583c5f31bd2459c07&username=myUser&hostname=host-1&service=cpu&start=1490997600&end=1493157600
If you are using SSL/TLS on your Central server, and if the certificate is self-signed or signed by an unknown authority, you must add it to the trusted certificates database:
Install ca-certificates package:
yum install -y ca-certificatesRetrieve and store certificate:
echo quit | openssl s_client -showcerts -servername <hostname> -connect <hostname>:<port> > /etc/pki/ca-trust/source/anchors/<hostname>.pemThe servername option value must be the exact hostname defined in the certificate. It must also be the hostname defined in Centreon Web configuration, and used by the reports scheduler to contact the Central server.
Reload the trusted certificates database:
update-ca-trustCBIS must be restarted after these actions.
Hostgroup-Graphs-v2
Description
This report presents round-robin database (RRD) graphs for the evolution and performance of Centreon services for a given host group over a defined period.
Parameters
Parameters required for the report:
- Reporting period
- The following Centreon objects:
| Parameter | Parameter type | Description |
|---|---|---|
| Report title | Text | Select title on cover page and report header. |
| Host group | Drop-down list | Select host group. |
| Service Categories | Multi select | Select service category. |
| Hosts Categories | Multi select | Select host categories. |
| Metrics | Multi select | Select metrics. If no metric is selected, graphs by metric will not be displayed. |
| Graphs display rule | Check box | Specify whether you want to see all the metrics on one graph for each service, a graph by metric, or both. |
Prerequisites
Go to Reporting > Business Intelligence > General Options > Scheduler Options and configure the following field:
![]()
In order to export RRD graphs using the Centreon API, the reporting server needs to access it using HTTP or HTTPS protocol. A curl command sent to the URL of the API should generate an image file.
curl http://$CENTREON-IP-OR-DNS$/centreon/include/views/graphs/generateGraphs/generateImage.php?akey=$AUTH_KEY$&username=$USER$&hostname=$HOSTNAME$&service=$SERVICENAME$&start=$TIMESTAMPSTART$&end=$TIMESTAMPEND$
Replace the values between $ signs with real values.
Example:
curl http://centreon.enterprise.com/centreon/include/views/graphs/generateGraphs/generateImage.php?akey=af9c583c5f31bd2459c07&username=myUser&hostname=host-1&service=cpu&start=1490997600&end=1493157600
If you are using SSL/TLS on your Central server, and if the certificate is self-signed or signed by an unknown authority, you must add it to the trusted certificates database:
Install ca-certificates package:
yum install -y ca-certificatesRetrieve and store certificate:
echo quit | openssl s_client -showcerts -servername <hostname> -connect <hostname>:<port> > /etc/pki/ca-trust/source/anchors/<hostname>.pemThe servername option value must be the exact hostname defined in the certificate. It must also be the hostname defined in Centreon Web configuration, and used by the reports scheduler to contact the Central server.
Reload the trusted certificates database:
update-ca-trustCBIS must be restarted after these actions.
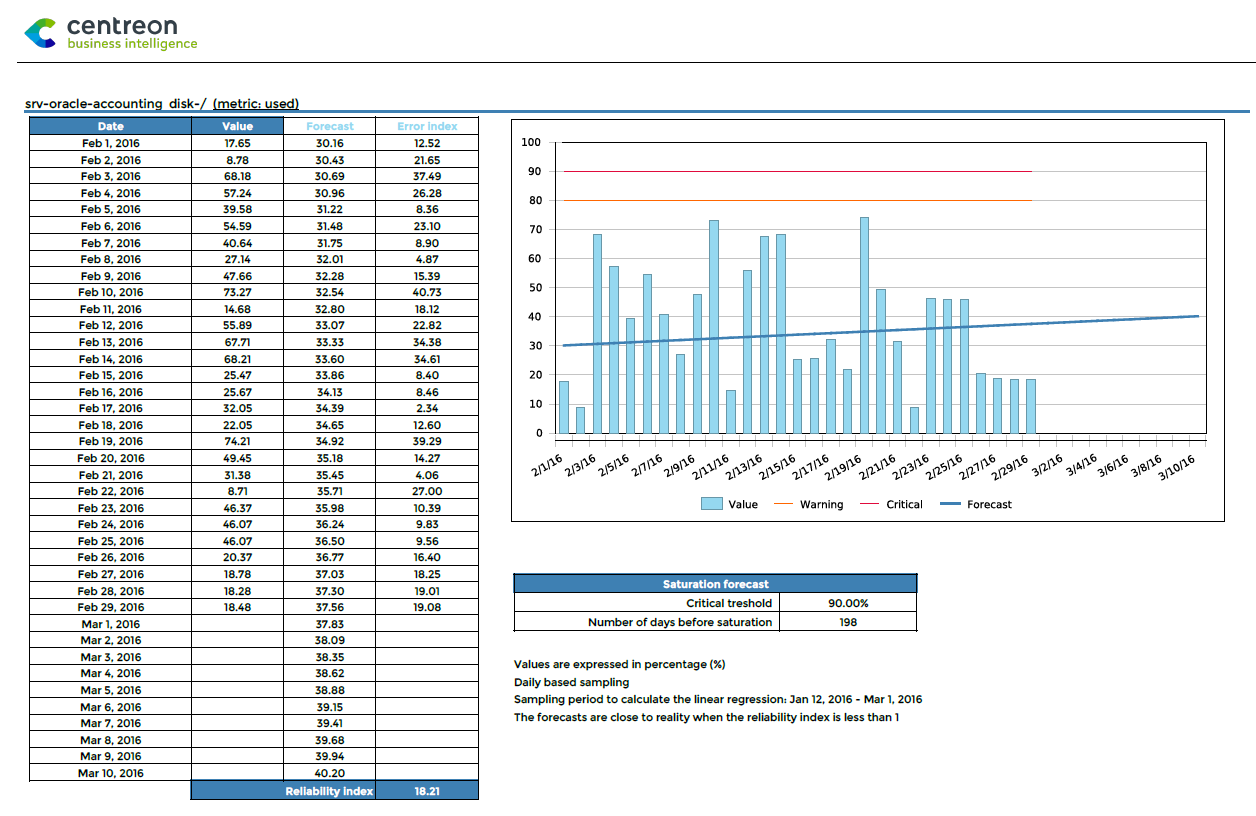
Hostgroup-Capacity-Planning-Linear-Regression
Description
This report shows the evolution and performance forecasting metrics for a host group.
How to interpret the report
The evolution of the value of the metric is represented on a graph and in a table. Forecasts are calculated from the value of the metric during the reporting period and projected into the future. An additional table provides information about critical threshold and days before saturation.
Parameters
Parameters required for the report:
- Reporting period
- The following Centreon objects:
| Parameter | Parameter type | Description |
|---|---|---|
| Host groups | Multi select | Select host groups for filter. |
| Host Categories | Multi select | Select host categories for filter. |
| Services Categories | Multi select | Select service categories for filter. |
| Time period | Dropdown list | Specify time period. |
| Metrics | Multi select | Select metric to include in report. |
| Historical period in days in addition to the reporting period | Number | Specify days used to calculate the linear regression before reporting period. |
| Forecast period in days | Number | Specify forecast days calculated by linear regression. |
Prerequisites
Metrics must return a maximum value on their performance data. Using warning and critical thresholds on performance data is highly recommended.
Performance data returned by a plugin must be formatted as follows, preceded by a pipe (|):
output-plugin | metric1=valeur(unité);seuil_warning;seuil_critique;minimum;maximum metric2=valeur ...
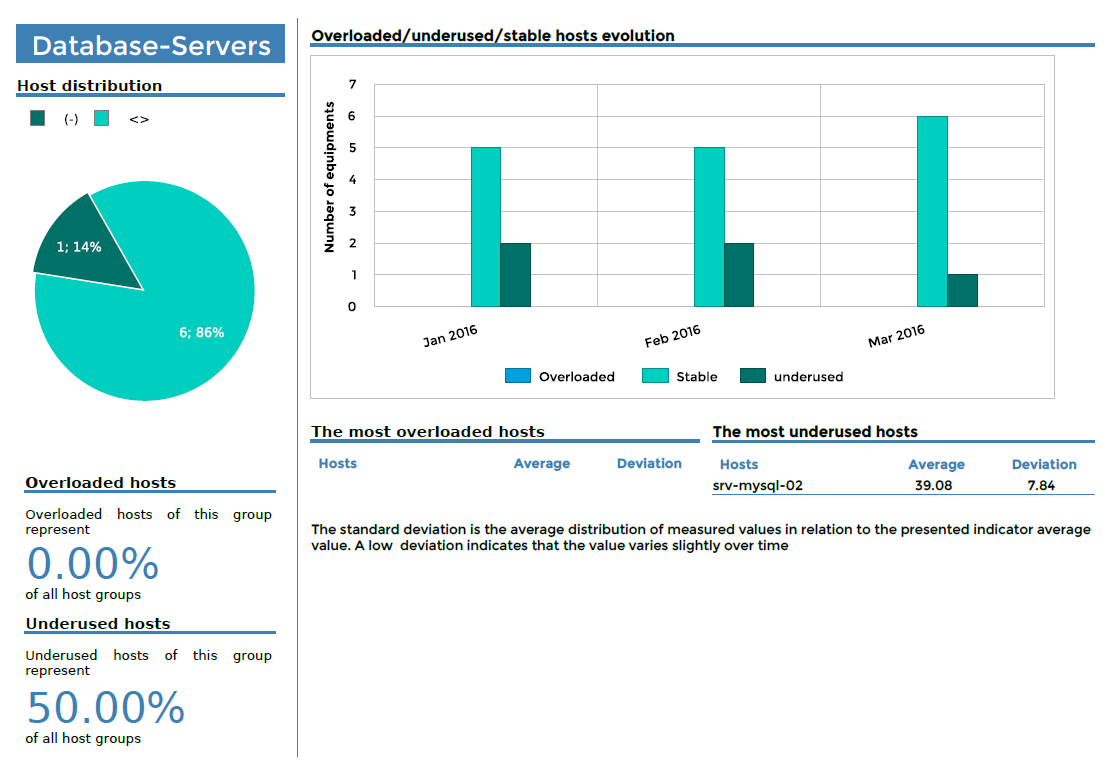
Hostgroups-Rationalization-Of-Resources-1
Description
This report provides an overview of resource usage by host groups and displays hosts and host groups that are overloaded or underused.
On the first page, this information is displayed for all host groups.
Then, for each host group a separate page is generated showing load distribution.
Summary page
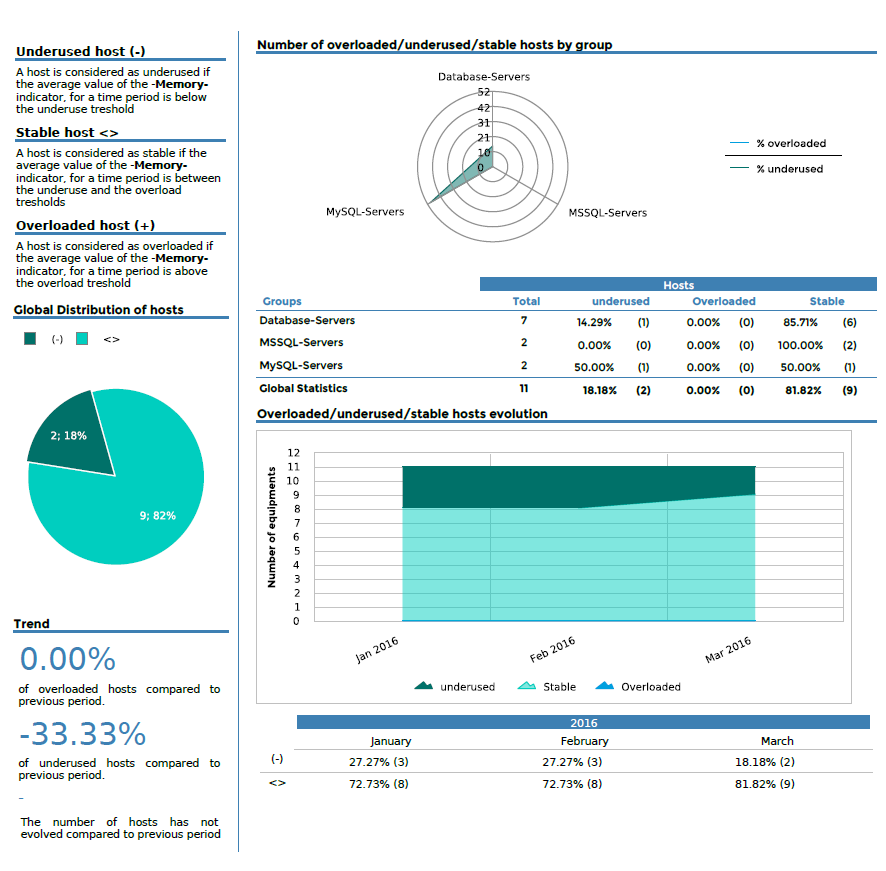
For each host group
Parameters
Parameters required for the report:
- Reporting period
- The following Centreon objects:
| Parameter | Parameter type | Description |
|---|---|---|
| Host groups | Multi select | Select host group. |
| Service Categories | Multi select | Select service category. |
| Hosts Categories | Multi select | Select host categories. |
| Metrics | Multi select | Select metrics. If no metric is selected, graphs by metric will not be displayed. |
| Time period | Dropdown list | Specify whether you want to see all the metrics on one graph for each service, a graph by metric, or both. |
| Interval | Text field | Specify no. of months to show in trend graphs. |
| overloaded | number | Specify threshold determining resource is overloaded. Unit : see prerequisites. |
| underused | number | Specify threshold determining resource is underused. Unit : see prerequisites. |
Prerequisites
This report can be generated using indicators that return a maximum value or not.
- If the metric has a maximum value, the threshold must be filled with a percent value (between 0 and 100).
- If the metric does not have a maximum value (e.g., counter for visitors on a website), the thresholds must be expressed in the same unit as the indicator (the counter for visitors).
Hostgroup-Service-Metric-Performance-List
Description
This report displays the average performance data for a list of services. It also shows the minimum and maximum values reached over the time period, the maximum potential value, and warning and critical thresholds for all service metrics selected.
- If the maximum value is returned by the plugin, the Average, Max and Min columns are displayed in percentage (%). The calculation is: value / maximum value.
- If the maximum value not returned by the plugin, the Average, Max and Min columns are displayed in the metric's units.
Parameters
Parameters required for the report:
- Reporting period
- The following Centreon objects:
| Parameter | Parameter type | Description |
|---|---|---|
| Hostgroup | Drop-down list | Select host group. |
| Host Categories | Multi selection | Select host categories. |
| Service Categories | Multi selection | Select service categories. |
| Metrics | Multi select | Specify metric to INCLUDE. |
| Time period | Dropdown list | Specify time period. |
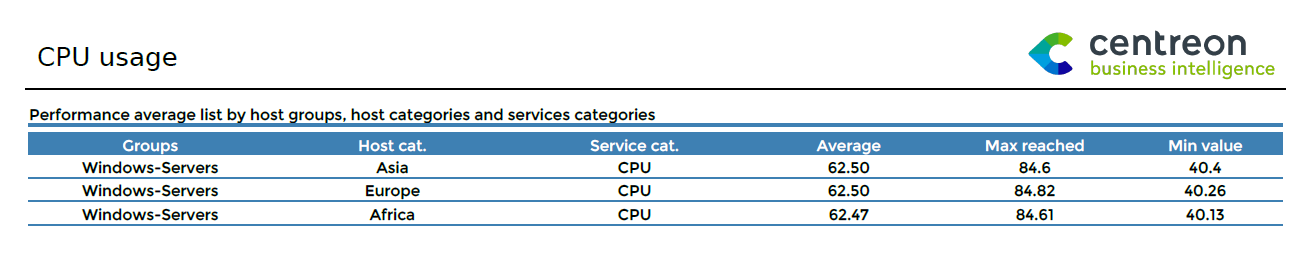
Hostgroups-Categories-Performance-List
Description
This report displays the average performance data for a list of host groups, host categories and service categories. It also shows the minimum and maximum value reached over the time period.
- If the maximum value is returned by the plugin, the Average, Max and Min columns are displayed in percentage (%). The calculation is: value / maximum value.
- If the maximum value is not returned by the plugin, the Average, Max and Min columns are displayed in the metric's units.
Parameters
Parameters required for the report:
- Reporting period
- The following Centreon objects:
| Parameter | Parameter type | Description |
|---|---|---|
| Hostgroups | Multi selection | Select host groups. |
| Host Categories | Multi selection | Select host categories. |
| Service Categories | Multi selection | Select service categories. |
| Metrics | Mutli select | Specify metric to INCLUDE. |
| Time period | Dropdown list | Specify time period. |
Storage
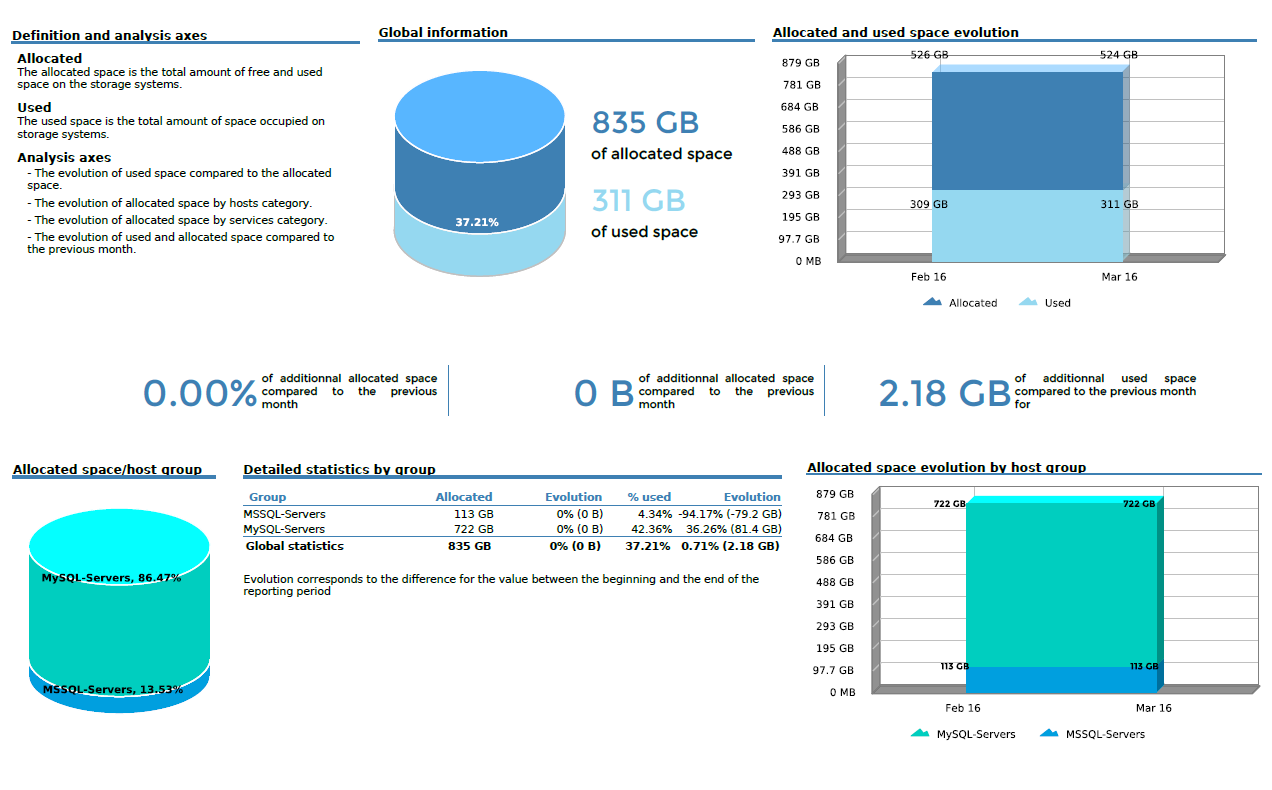
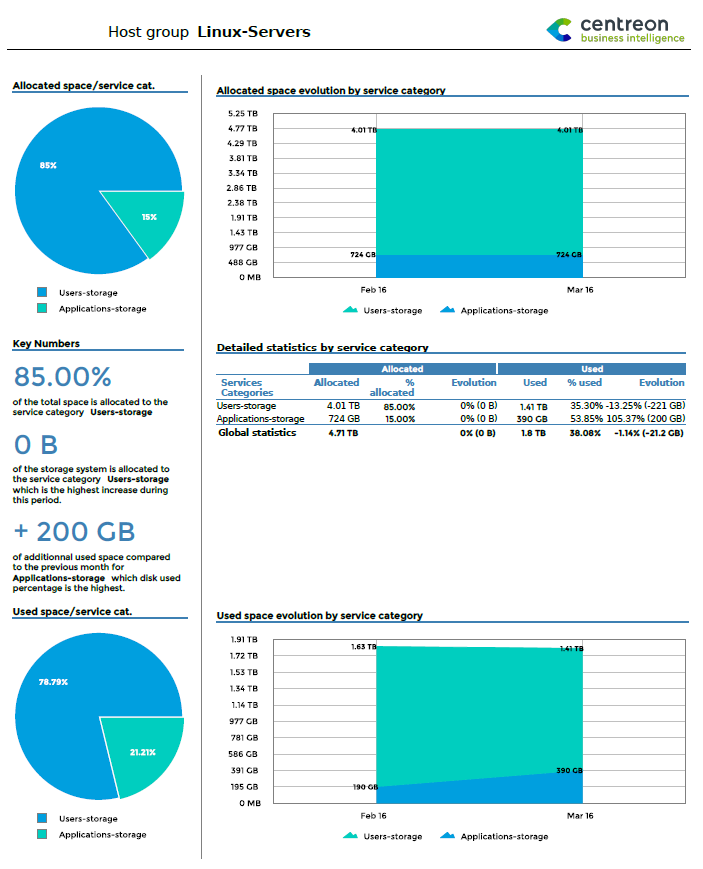
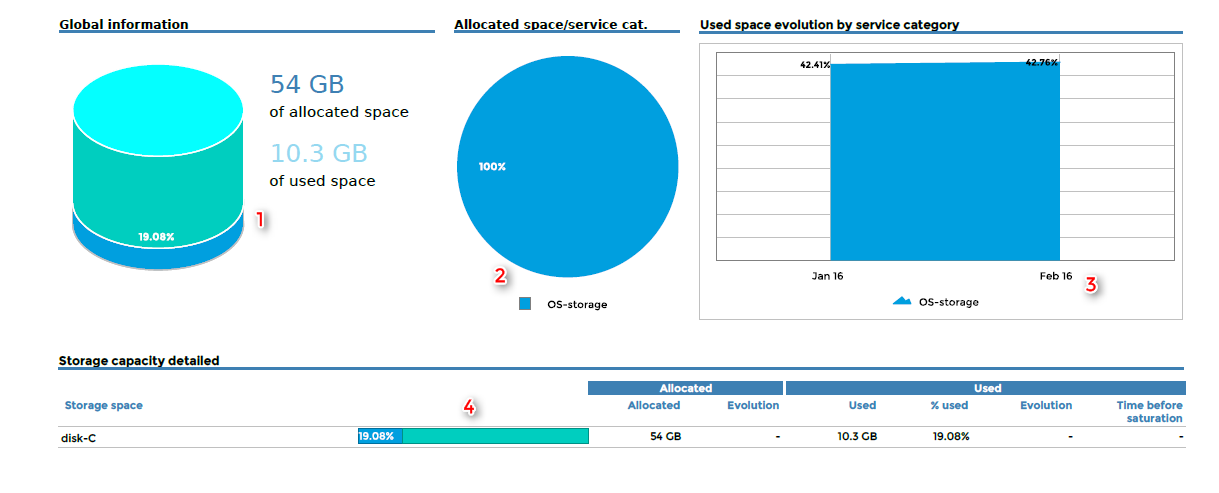
Hostgroups-Storage-Capacity-1
Description
This report displays statistics on allocated and used storage space for multiple host groups.
How to interpret the report
On the first page, statistics are summarized by host group.
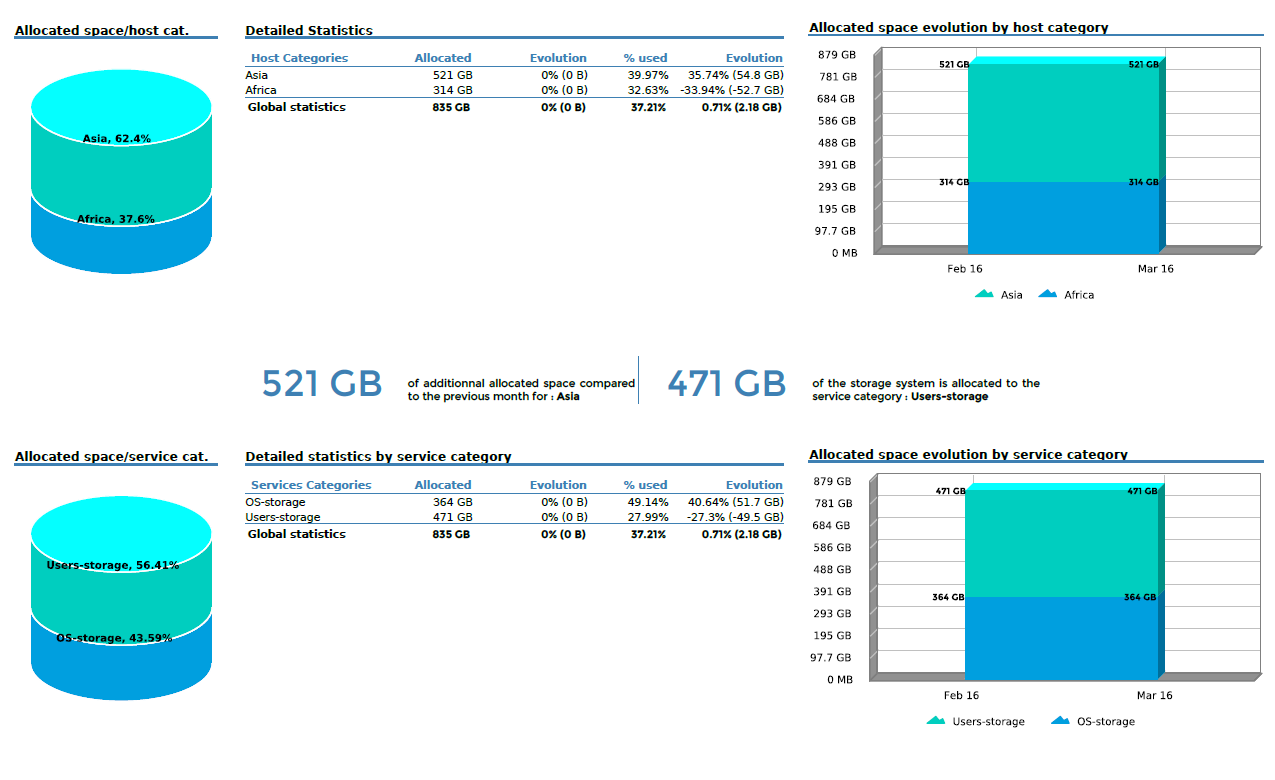
On the second page, statistics are displayed by host category and service category.
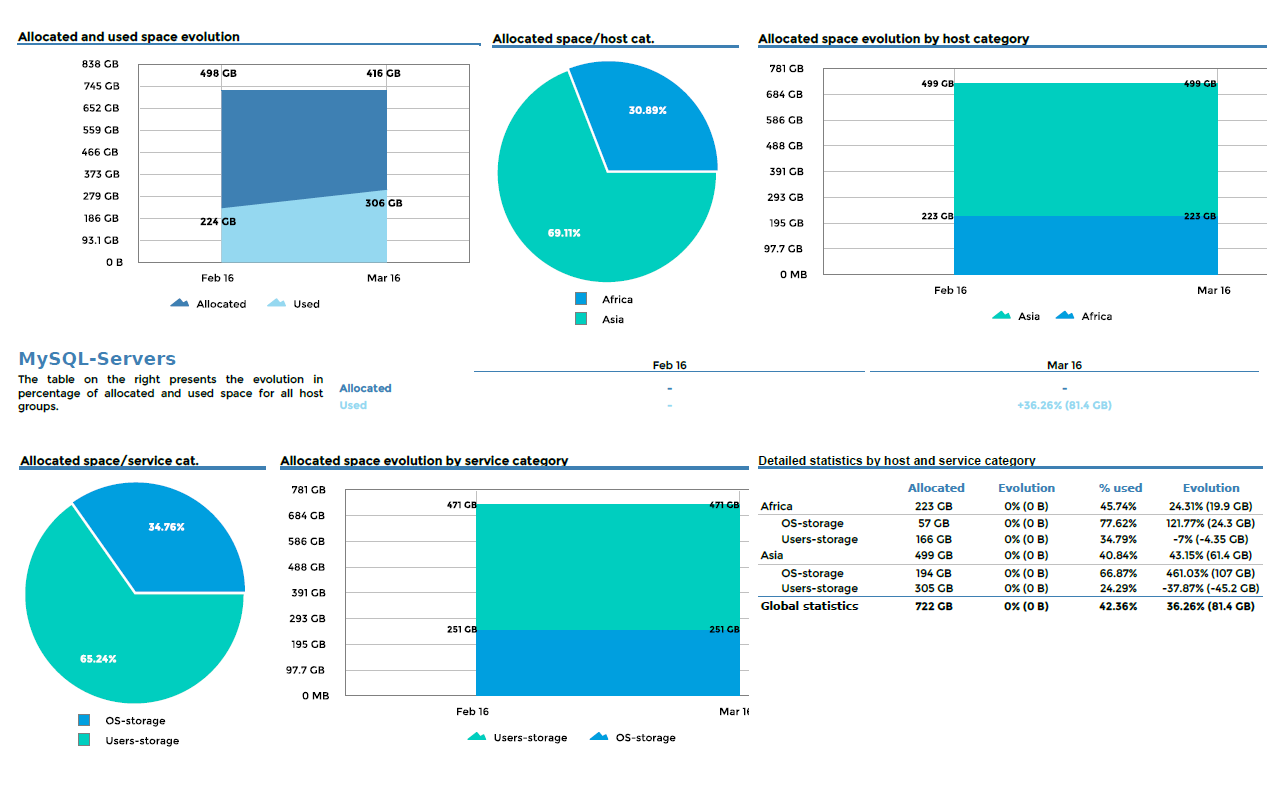
On the following pages, overall statistics are detailed for each host group, displayed by host categories and service categories.
First page
Second page
For each host group
Statistics displayed in evolution tables and graphs by month correspond to values of indicators measured on the last day of the month. "Snapshot" statistics (versus evolution statistics by month) correspond to values of indicators measured the last day of the reporting period. Evolution calculations are based on a comparison of the values of indicators the last day of the reporting period with the values of indicators the day before the first day of the reporting period.
Parameters
Parameters required for the report:
- Reporting period
- The following Centreon objects:
| Parameter | Parameter type | Description |
|---|---|---|
| Hostgroups | Multi selection | Select host groups. |
| Host Categories | Multi selection | Select host categories. |
| Service Categories | Multi selection | Select service categories. |
| Metrics | Mutli select | Specify metric to INCLUDE. |
| Time period | Dropdown list | Specify time period. |
| Evolution interval | Text field | Specify number of historical months for the evolution graphics. |
Prerequisites
For consistency in graphs and statistics, certain prerequisites apply to performance data returned by the storage plugins. This data must be formatted as follows, preceded by a pipe (|):
output-plugin | metric1=valueunit;warning_treshold;critical_treshold;minimum;maximum metric2=value...
Make sure that the plugins return the maximum value, which is required in order to calculate statistics. The unit must be expressed in bytes.
Warning
- The ETL configuration must include service categories for storage, otherwise the evolution graphics remain empty.
- This report is compatible with the 24x7 time period only. This time period must be configured on the menu "General options | Capacity statistic aggregated by month | Live services for capacity statistics calculation".
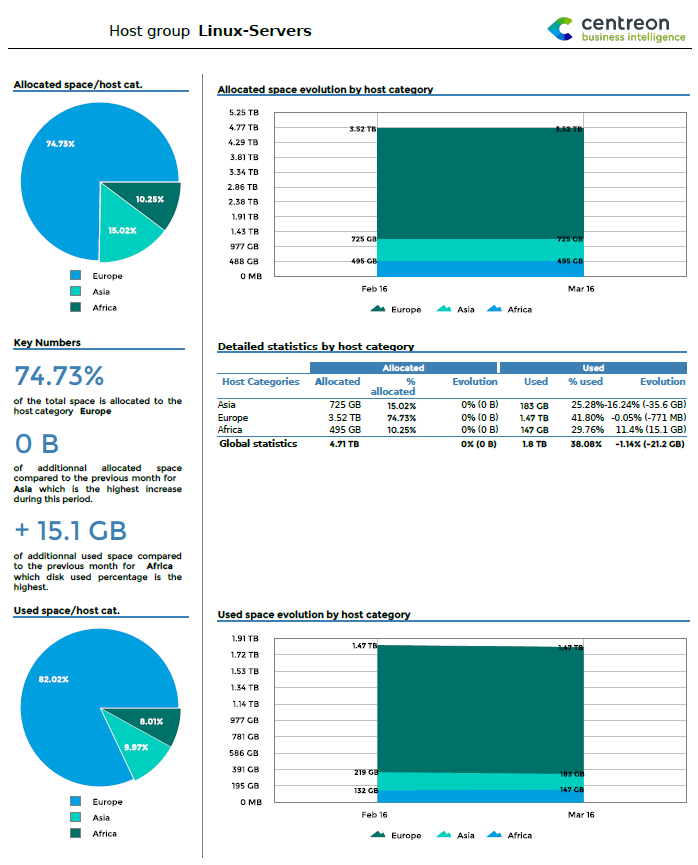
Hostgroup-Storage-Capacity-2
Description
This report provides detailed storage statistics and shows the evolution of the storage space of your IT infrastructure.
How to interpret the report
The first page displays overall information about allocated and used space for host groups. A graph traces the past evolution of these two parameters. Two tables list the most critical information for hosts in terms of storage space.
On the second and third pages, statistics for allocated and used space are organized by service category and host category.
The fourth page shows storage space per host group, with the allocated and used space for each partition, the evolution over the last month, and estimated time before saturation.
First page
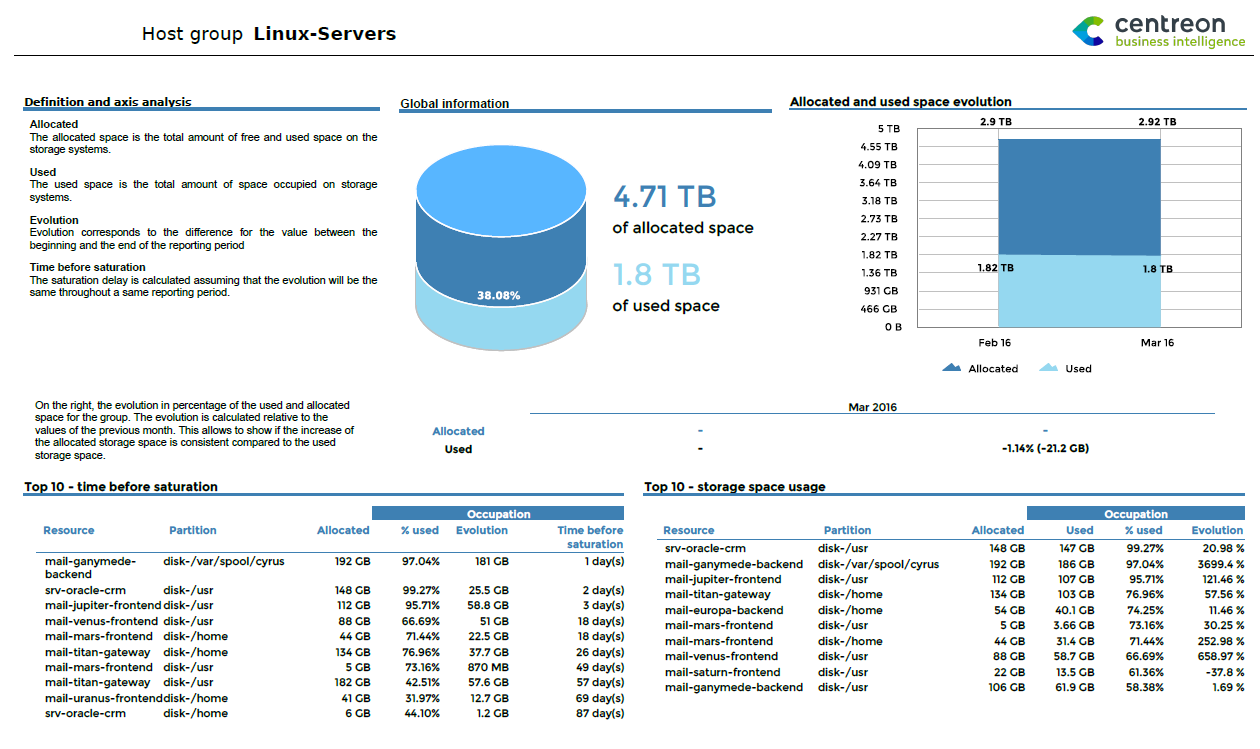
Second & third pages
By service categories
By host categories
Fourth page
Statistics displayed in evolution tables and graphs by month correspond to values of indicators measured on the last day of the month. "Snapshot" statistics (versus evolution statistics by month) correspond to values of indicators measured the last day of the reporting period. Evolution calculations are based on comparing the values of indicators the last day of the reporting period with the values of indicators the day before the first day of the reporting period.
Parameters
Parameters required for this report:
- The reporting period
- The following Centreon objects:
| Parameter | Parameter type | Description |
|---|---|---|
| Hostgroup | Dropdown list | Select host groups. |
| Host Categories | Multi selection | Select host categories. |
| Service Categories | Multi selection | Select service categories. |
| Metrics | Multi select | Specify metric to INCLUDE. |
| Time period | Dropdown list | Specify time period. |
| Evolution interval | Text field | Specify number of historical months for the evolution graphics. |
Prerequisites
For consistency in graphs and statistics, certain prerequisites apply to performance data returned by the storage plugins. This data must be formatted as follows, preceded by a pipe (|):
output-plugin | metric1=valueunit;warning_treshold;critical_treshold;minimum;maximum metric2=value...
Make sure that the plugins return the maximum value, which is required in order to calculate statistics. The unit must be expressed in bytes.
Warning
- The ETL configuration must include service categories for storage, otherwise the evolution graphics remain empty.
- This report is compatible with the 24x7 time period only. This time period must be configured via the "General options | Capacity statistic aggregated by month | Live services for capacity statistics calculation" menu.
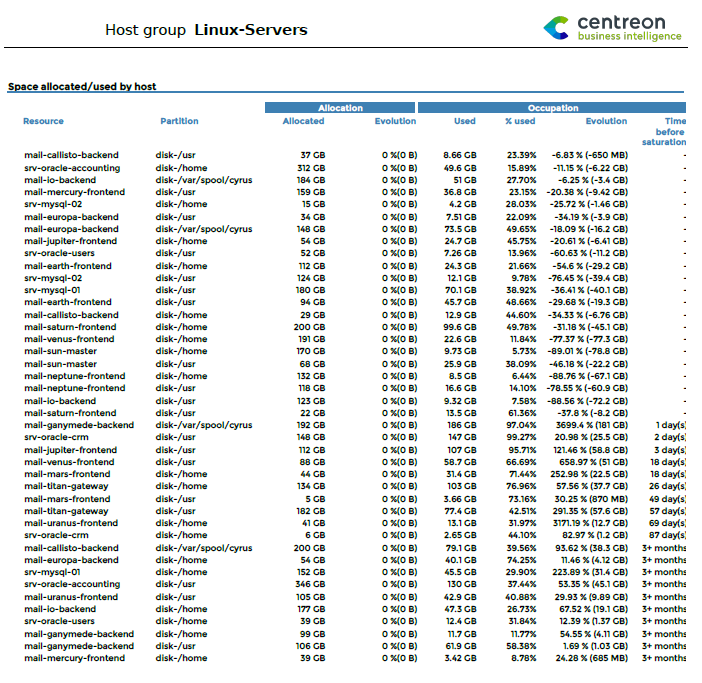
Hostgroup-Storage-Capacity-List
Description
This report displays storage space usage on hosts within a host group.
How to interpret the report
The report presents a table with all available partitions for a hostgroup's resources. Detailed information is provided on the allocated and used space, the change since the last month, and estimated time before saturation.
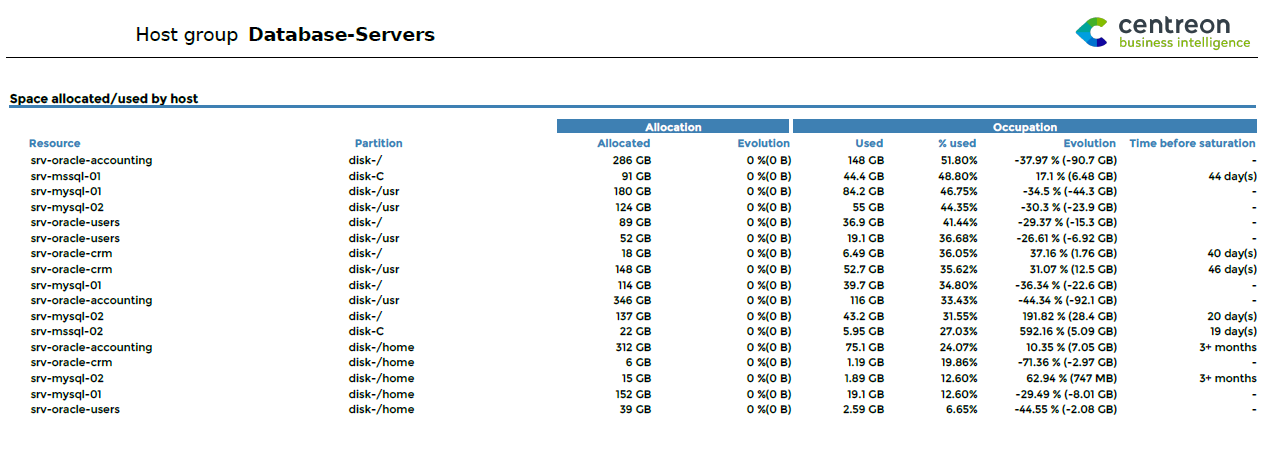
Statistics displayed in evolution tables and graphs by month correspond to values of indicators measured on the last day of the month. "Snapshot" statistics (versus evolution statistics by month) correspond to values of indicators measured the last day of the reporting period. Evolution calculations are based on comparing the values of indicators the last day of the reporting period with the values of indicators the day before the first day of the reporting period.
Parameters
Parameters required for the report:
- Reporting period
- The following Centreon objects:
| Parameter | Parameter type | Description |
|---|---|---|
| Hostgroup | Dropdown list | Select host groups. |
| Host Categories | Multi selection | Select host categories. |
| Service Categories | Multi selection | Select service categories. |
| Metrics | Multi select | Specify metric to INCLUDE. |
| Time period | Dropdown list | Specify time period. |
Prerequisites
For consistency in graphs and statistics, certain prerequisites apply to performance data returned by the storage plugins. This data must be formatted as follows, preceded by a pipe (|):
output-plugin | metric1=valueunit;warning_treshold;critical_treshold;minimum;maximum metric2=value...
Make sure that the plugins return the maximum value, which is required in order to calculate statistics. The unit must be expressed in bytes.
Network
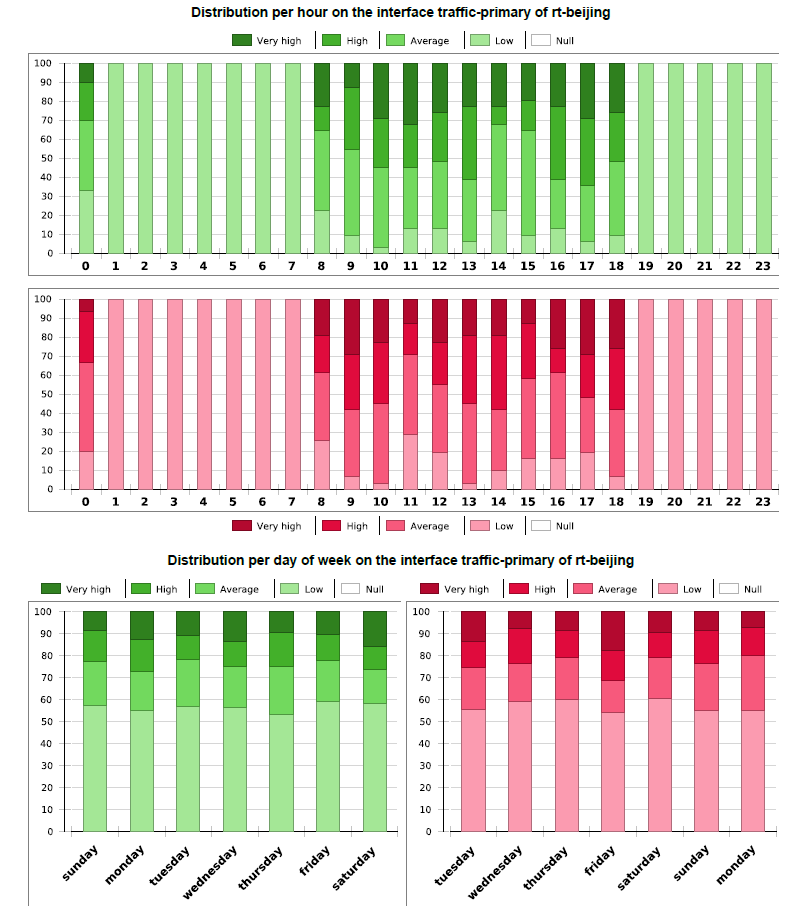
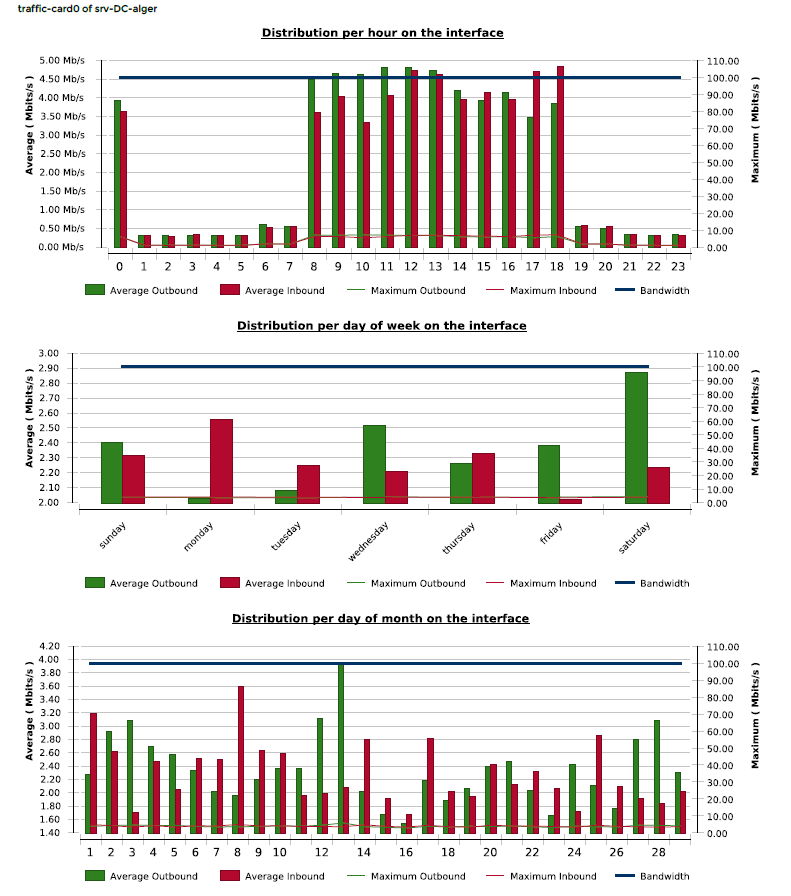
Hostgroup-Traffic-By-Interface-And-Bandwith-Ranges
Description
This report shows the average inbound and outbound bandwidth usage of network interfaces for a given host group.
How to interpret the report**
First page
The first page displays the bandwidth usage ranges in percentage by interval.
Intervals are:
- Null usage
- Low usage
- Average usage
- High usage
- Very high usage.
These intervals are configurable.
Following pages
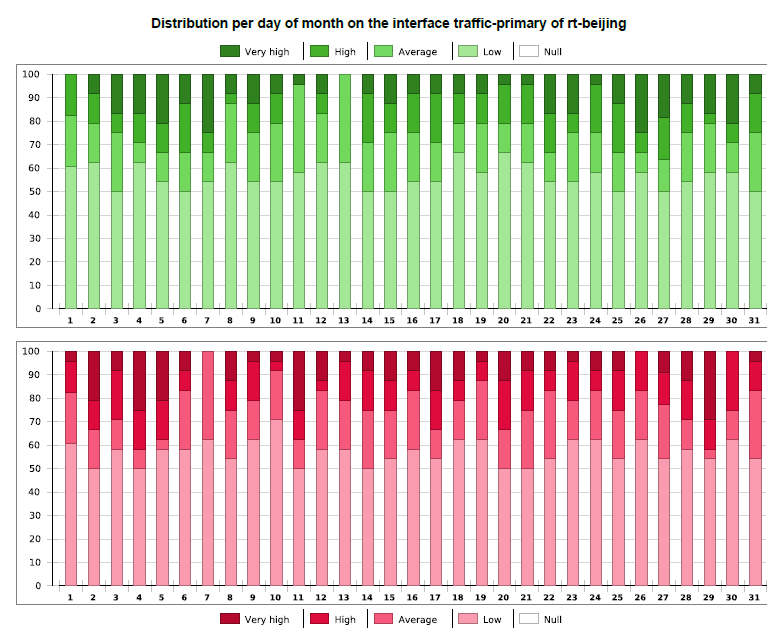
The following pages are automatically generated for all interfaces of the selected host group (one page per interface). Each page displays the bandwidth usage by interval with distribution by:
- Hour of the day
- Day of the week
- Day of the month.
Parameters
Parameters required for the report:
- Reporting period
- The following Centreon objects:
| Parameter | Parameter type | Description |
|---|---|---|
| Host Group | Dropdown list | Select host group. |
| Host Categories | Multi select | Select host categories. |
| Service Categories | Multi select | Select service categories. |
| Low-level threshold (%) | Number | Specify low threshold of bandwidth usage (between 0 and 100). |
| Average-level threshold (%) | Number | Average threshold of bandwidth usage (between 0 and 100) |
| High-level threshold (%) | Number | Specify high threshold of bandwidth usage (between 0 and 100) |
| Inbound traffic metric | Dropdown list | Specify metric of inbound traffic. |
| Outbound traffic metric | Dropdown list | Specify metric of outbound traffic. |
Prerequisites
For consistency in graphs and statistics, certain prerequisites apply to performance data returned by the storage plugins. This data must be formatted as follows, preceded by a pipe (|):
output-plugin | traffic_in=valueunit;warning_treshold;critical_treshold;minimum;maximum traffic_out=value
Make sure the plugins return the maximum value, which is required in order to calculate statistics. The storage plugins must return one metric for traffic in and one for traffic out. Units must be in Bits/sec.
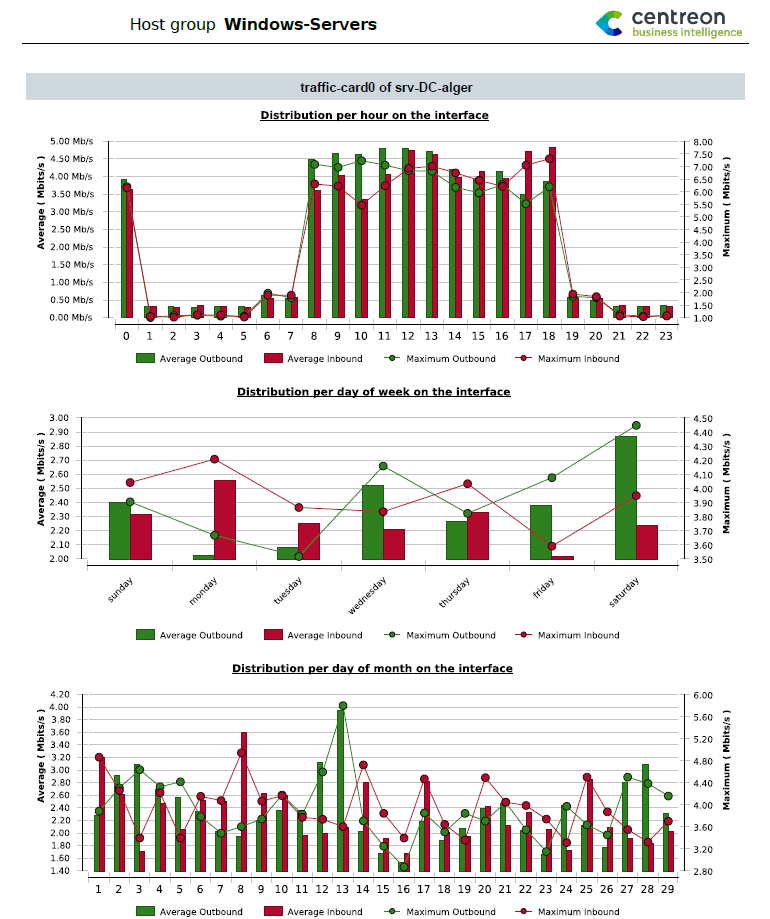
Hostgroup-Traffic-average-By-Interface
Description
This report shows the average inbound and outbound bandwidth usage of network interfaces for a given host group.
How to interpret the report
First page
On the first page, we can see the distribution of bandwidth usage in percent per interval.
Intervals are:
- Null usage
- Low usage
- Average usage
- High usage
- Very high usage.
These intervals are configurable.
Following pages
The following pages are automatically generated for all interfaces of the selected host group (one page per interface). Each page dispays the bandwidth distribution by:
Hour of the day displaying:
- The average usage by hour of the day of incoming and outgoing traffic for the selected reporting period.
- The maximum reached of incoming and outgoing traffic per hour of the day for the reporting period.
Day of the week displaying
- The average usage by day of the week of incoming and outgoing traffic for the selected reporting period.
- The maximum reached of incoming and outgoing traffic per day of the week for the reporting period.
Day of the month displaying
- The average usage by day of the month of incoming and outgoing traffic for the selected reporting period.
- The maximum reached of incoming and outgoing traffic per day of the month for the reporting period.
Parameters
Parameters required for the report:
- Reporting period
- The following Centreon objects:
| Parameter | Parameter type | Description |
|---|---|---|
| Hostgroup | Dropdown list | Select host group. |
| Host Categories | Multi select | Select host categories. |
| Service Categories | Multi select | Select service categories. |
| Low level threshold (%) | Number | Specify low threshold of bandwidth usage (between 0 and 100) |
| Average level threshold (%) | Number | Average threshold of bandwidth usage (between 0 and 100). |
| High level threshold (%) | Number | Specify high threshold of bandwidth usage (between 0 and 100). |
| Inbound traffic metric | Dropdown list | Specify metric of inbound traffic. |
| Outbound traffic metric | Dropdown list | Specify metric of outbound traffic. |
It is important to make sure that plugins return the maximum value because many statistics are based on a percentage, calculated using this maximum value. Be sure that the traffic plugins return one metric for traffic in and one for traffic out. The unit must be Bits/sec.
Prerequisites
For consistency in graphs and statistics, certain prerequisites apply to performance data returned by the storage plugins. This data must be formatted as follows, preceded by a pipe (|):
output-plugin | traffic_in=valueunit;warning_treshold;critical_treshold;minimum;maximum traffic_out=value
Make sure the plugins return the maximum value, which is required in order to calculate statistics. The storage plugins must return one metric for traffic in and one for traffic out. Units must be in Bits/sec.
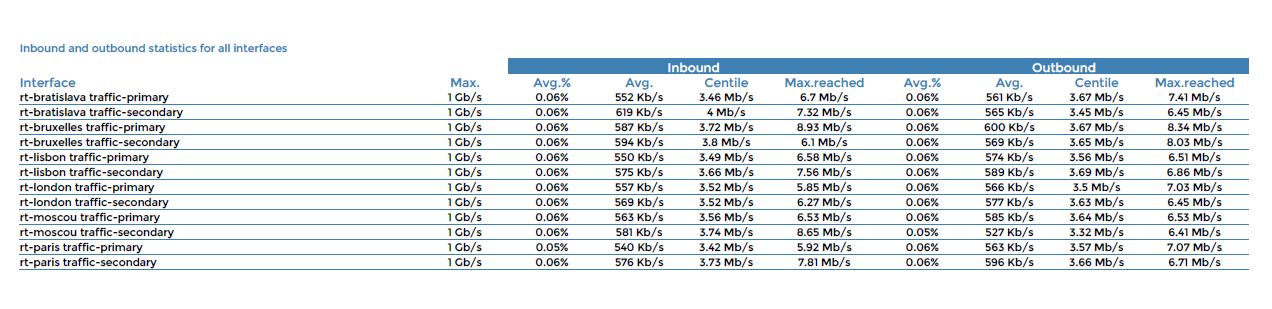
Hostgroup-monthly-network-percentile
Description
This report provides statistics on inbound and outbound traffic by interface in terms of average and percentile values. This report applies only to one month.
How to interpret the report
The first page displays three types of information:
- Two graphs representing the 10 interfaces having the maximum centile for inbound and outbound traffic
- 10 interfaces having the maximum average inbound traffic in percentage
- 10 interfaces having the maximum average outbound traffic in percentage.
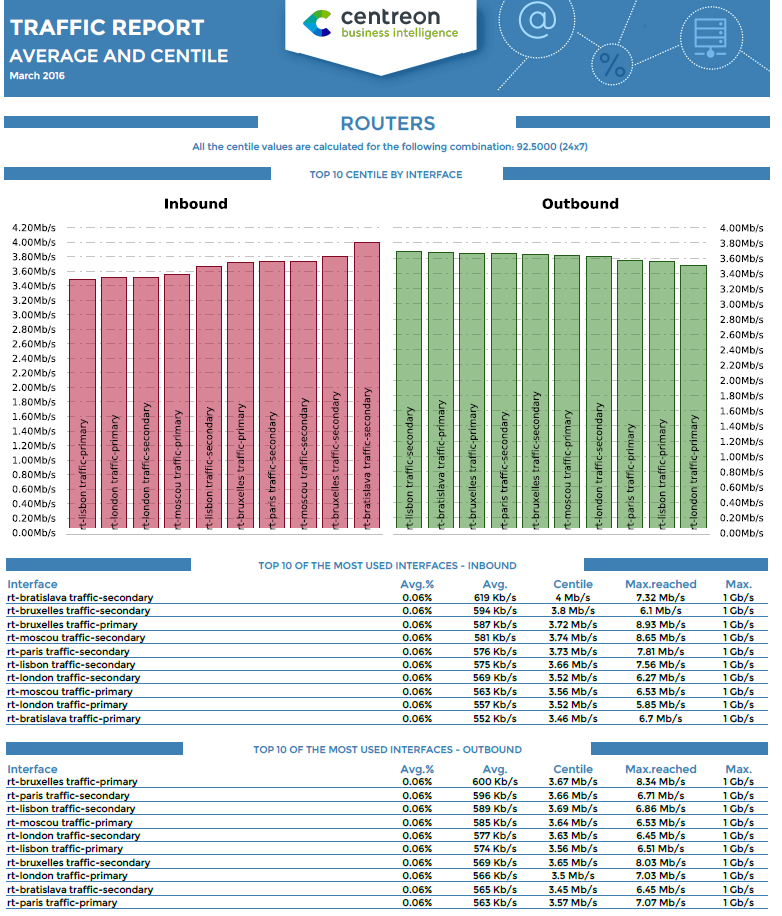
On the following page(s), all interfaces are listed, sorted by host and service name, each with the corresponding inbound and outbound traffic statistics.
Parameters
Parameters required for the reports:
- A start date corresponding to the month for generating the report (corresponding to the start date on the Centreon MBI interface).
- The following Centreon objects:
| Parameters | Parameter type | Description |
|---|---|---|
| Host group | Dropdown list | Select host group. |
| Host Categories | Multi select | Select host categories. |
| Traffic service categories | Dropdown list | Select service category. |
| Time period for average usage | Dropdown list | Specify low threshold of bandwidth usage. |
| Centile/Time period | Dropdown list | Specify combination for centile statistics. |
| Inbound traffic metric | Dropdown list | Specify metric name of inbound traffic. |
| Outbound traffic metric | Dropdown list | Specify metric name of outbound traffic. |
Prerequisites
- Percentile should be correctly configured in the General Options > ETL tab menu.
- For consistency in graphs and statistics, certain prerequisites apply to performance data returned by the storage plugins. This data must be formatted as follows, preceded by a pipe (|):
output-plugin | traffic_in=valueunit;warning_treshold;critical_treshold;minimum;maximum traffic_out=value
Make sure the plugins return the maximum value, which is required in order to calculate statistics. The storage plugins must return one metric for traffic in and one for traffic out. Units must be in Bits/sec.
Virtualization
VMWare-Cluster-Performances-1
Description
This report displays CPU and memory performance for an ESX cluster including the use of hosted virtual machines and datastores.
How to interpret the report
For a given ESX cluster and a specific reporting period as input, the report displays the following information:
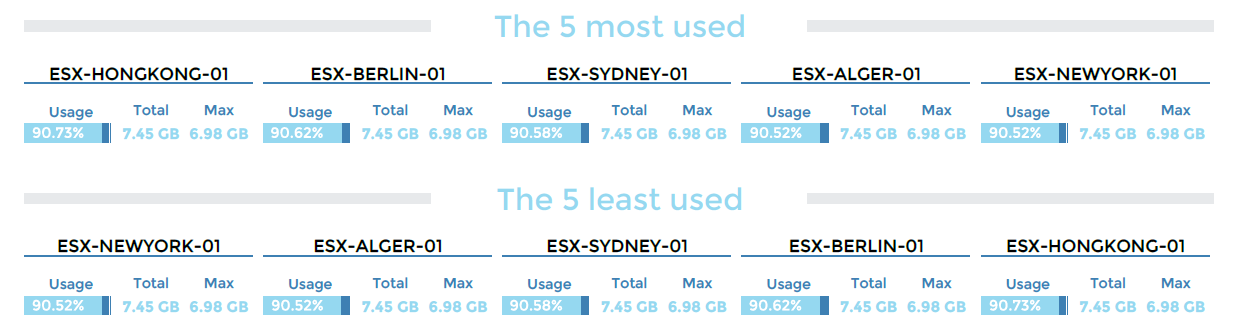
On the first page, the report shows the total number of datastores available on the cluster. Included are average usage of space, expressed in percentage and bytes, the last usage value for the selected period and allocated space for all datastores. The evolution of these three values is shown in comparison to the previous period.
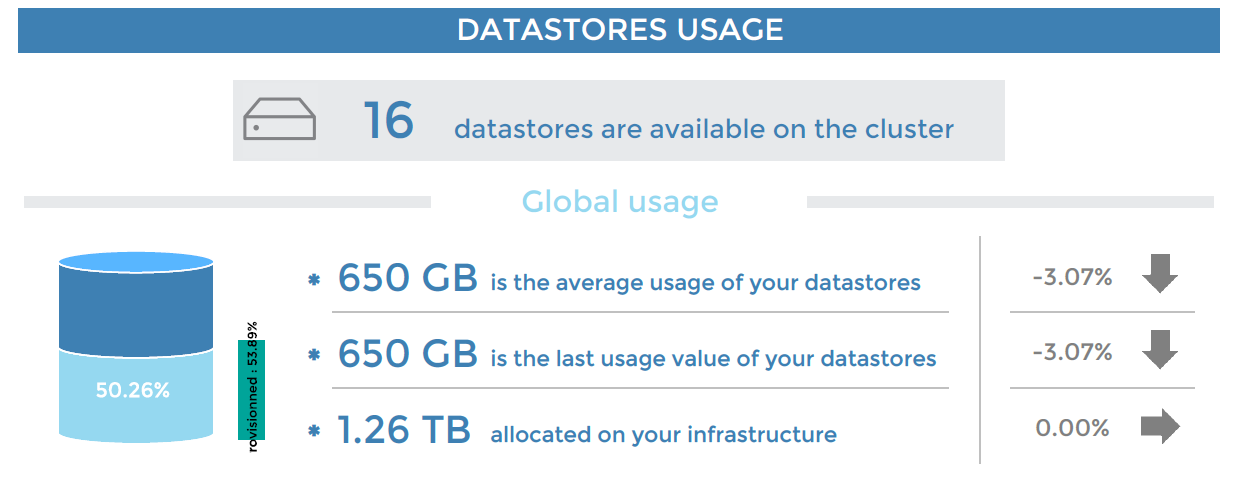
Next, the top five and a bottom five datastores used are presented. For each datastore, you can see the percentage of usage, the maximum value reached and allocated space.
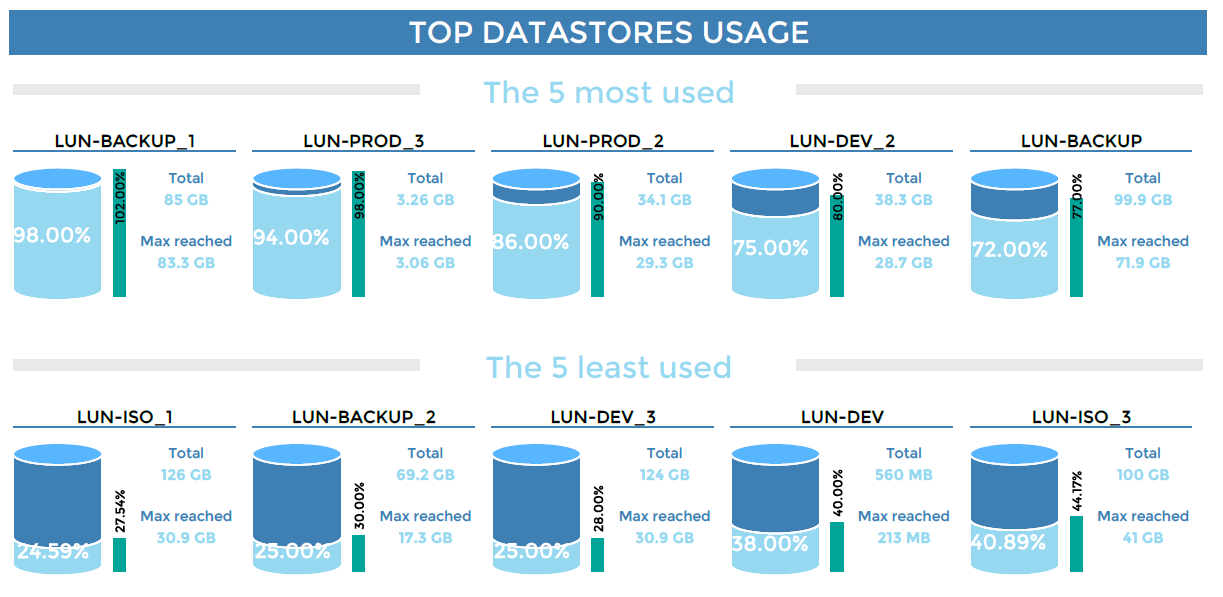
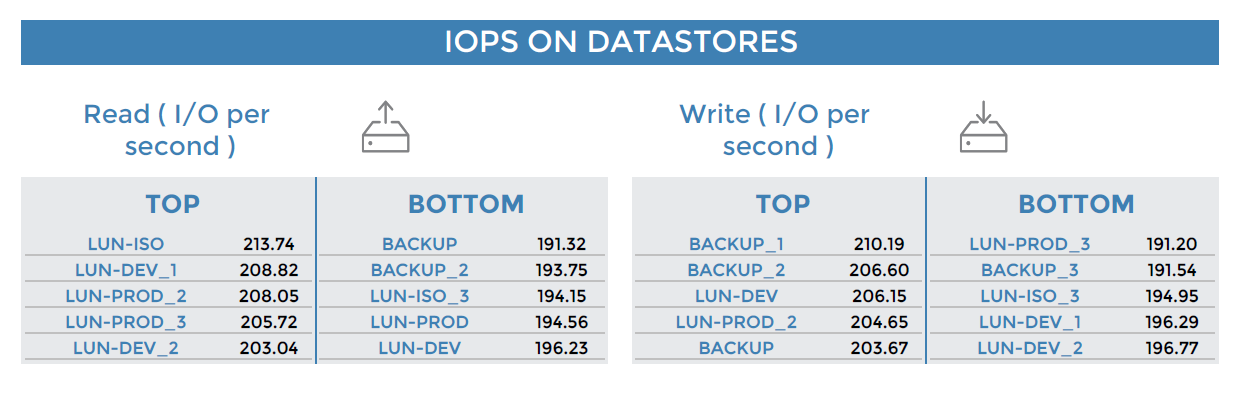
The report then displays the top five and bottom five datastores generating read and write IOPS (input/output per second).
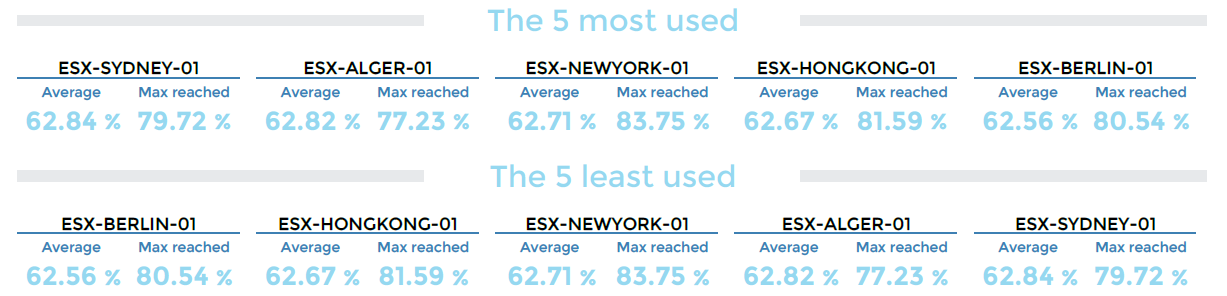
The second page shows average CPU consumption for all ESX clusters and the evolution from the previous period.

ESXs using the most and the least CPU are highlighted, with the average consumption and the maximum value reached for each ESX.
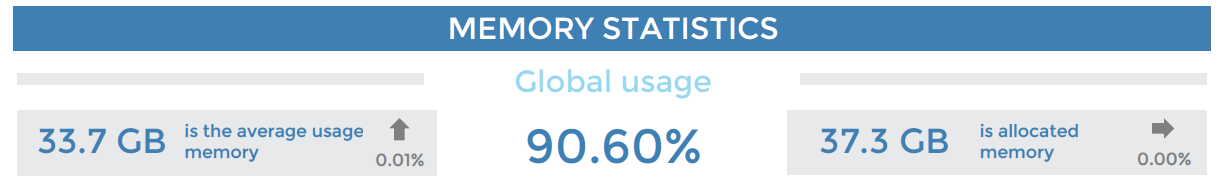
The report shows the average memory usage on all ESX clusters and the total memory allocated.
The top and bottom five memory-consuming ESXs are highlighted along with average usage over time, the total memory available and the maximum value reached for each ESX.
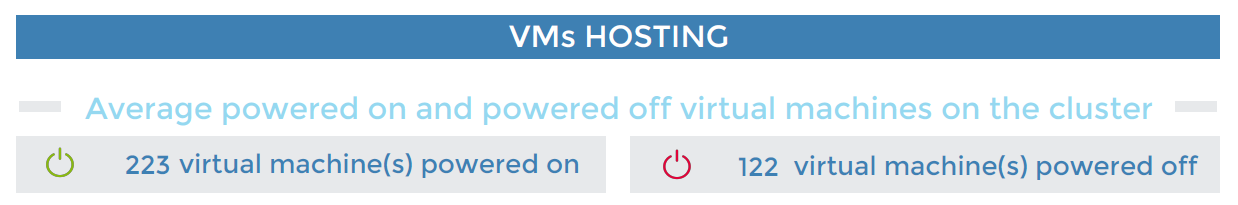
Finally, an overview of the average number of virtual machines on the cluster that have been powered on and powered off.
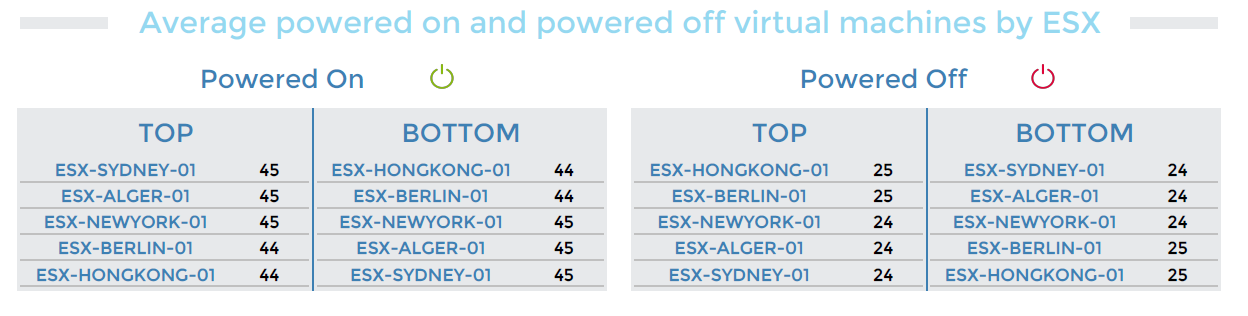
The report provides details on the ESXs hosting the greatest and fewest number of virtual machines powered on and powered off:
Parameters
Parameters required for the report:
- The reporting period
- The following Centreon objects:
| Parameter | Type | Description |
|---|---|---|
| Time period | Dropdown list | Select time period. |
| Host group | Dropdown list | Select cluster. |
| Host category | Multi selection | Select host categories for filtering on cluster. |
| Datastore Service category | Multi selection | Select service categories with datastore usage. |
| IOPs Service category | Multi selection | Select service categories with datastore IOPS. |
| CPU Service category | Multi selection | Select service categories with the ESX CPU usage. |
| Memory Service category | Multi selection | Select service categories with the ESX Memory usage. |
| VM Count Service category | Multi selection | Select service categories with the VM count services on ESXs. |
| Datastore usage (filter) | Text field | Type common part for filter and replacement (% to keep all). |
| Datastore iops (filter) | Text field | Type common part for filter and replacement (% to keep all). |
Prerequisites
This report is developed for full compatibility with the Monitoring Connector Virt-VMware2-ESX and the Centreon-VMWare-2.0 connector. The following prerequisites for the proper generation of the report shall apply.
Implement monitoring of the following indicators:
- CPU service, a memory service and a VM Count service for each ESX.
- Datastore-usage service for each datastore, or for all datastores, linked to the vCenter or to only one ESX of the cluster. By default, the service will have the following nomenclature: Datastore-Usage-xxxx (xxxx is the datastore name).
- Datastore-IOPS service for each datastore or for all datastores, linked to the vCenter or to only on ESX of the cluster. By default, the service will have the following nomenclature: Datastore-Iops-xxxx (xxxx is the datastore name).
Create host groups that correspond to the clusters. A cluster (host group) contains:
- Several ESXs (hosts).
- The vCenter, only if Datastore-usage and Datastore-IOPS services are linked to the vCenter and not to one cluster's ESX.
Create at least one host category containing the whole cluster (vCenter + ESXs). If there are multiple ESX clusters, you can split them into several host categories to filter the report on a single cluster.
Create the following service categories:
- CPU-ESX: combines all CPU indicators on ESXs.
- Memory-ESX: combines all memory indicators on ESXs.
- VMcount-ESX: combines all VM Count indicators on ESXs.
- Datastore-usage: combines all datastore usage indicators.
- Datastore-IOPS: combines all datastore IOPS indicators.
If a datastore or an ESX host name contains more than 16 characters, only the first 16 will be shown, supplemented by 3 dots.
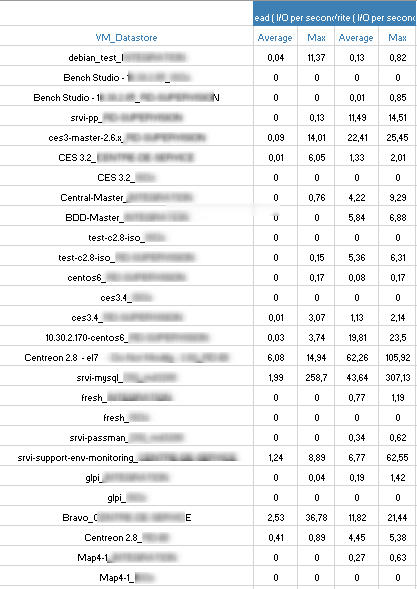
VMWare-VM-Performances-List
Description
This report displays statistics on usage of the vCPU, memory and IOPS on virtual machines.
It has been optimized for generating XLSX files to create the desired filters and perform sorting.
How to interpret the report
The first tab shows information on the reporting period, the live-service period selected and the report generation day and time.

The second tab lists the virtual machines with vCPU usage (average, average formatted, max, max formatted) and memory usage (average, average formatted, max, max formatted, % of usage, % of usage formatted).
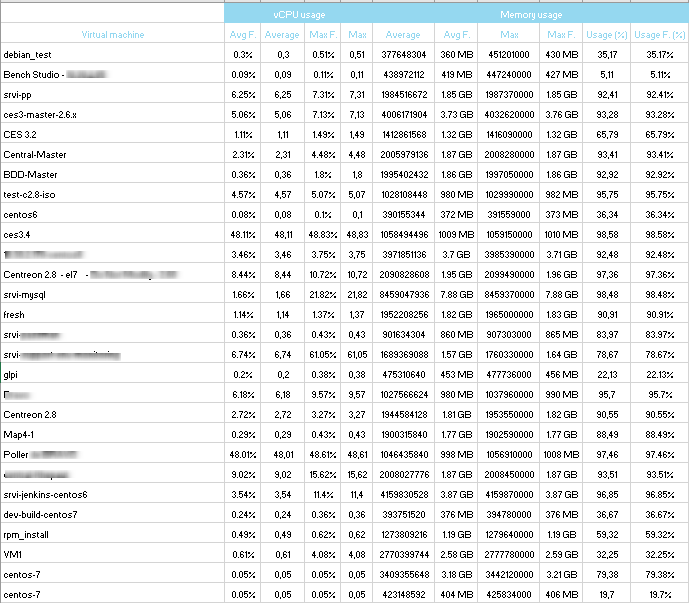
The last tab lists the virtual machines by datastore and their read/write IOPS usage showing the average and the maximum reached.
Parameters
Parameters required for the report:
- The reporting period
- The following Centreon objects:
| Parameters | Type | Description |
|---|---|---|
| Time period | Dropdown list | Specify the reporting live service. |
| Host to report | Dropdown list | Select the vCenter for report. |
| Host category | Multi selection | Select host category for filter. |
| Service category | Multi selection | Select service category containing the global VM statistics. |
Prerequisites
This report is developed for full compatibility with the Virt-VMware2-ESX Monitoring Connector and Centreon-VMWare-2.0 connector. Certain prerequisites apply to ensure proper report creation:
Monitoring of the following indicators:
- Vm-Cpu-Global service
- Vm-Memory-Global service
- Vm-Datastore-Iops-Global service.
Creation of the following service category:
- VM-Statistics with these indicators: Vm-Cpu-Global, Vm-Memory-Global and Vm-Datastore-Iops-Global.
Electric consumption
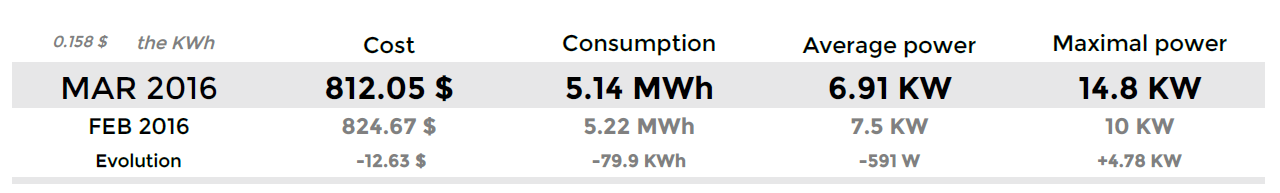
Hostgroup-Electricity-Consumption-1
Description
This report displays statistics on the energy consumption of the hosts connected to an uninterrupted power supply (UPS).
How to interpret the report
For a given host group, reporting period and price per kilowatt-hour, the first table displays the cost, consumption, average power and maximum power reached for month N. A reminder of these values for the previous month is provided along with the evolution over time.
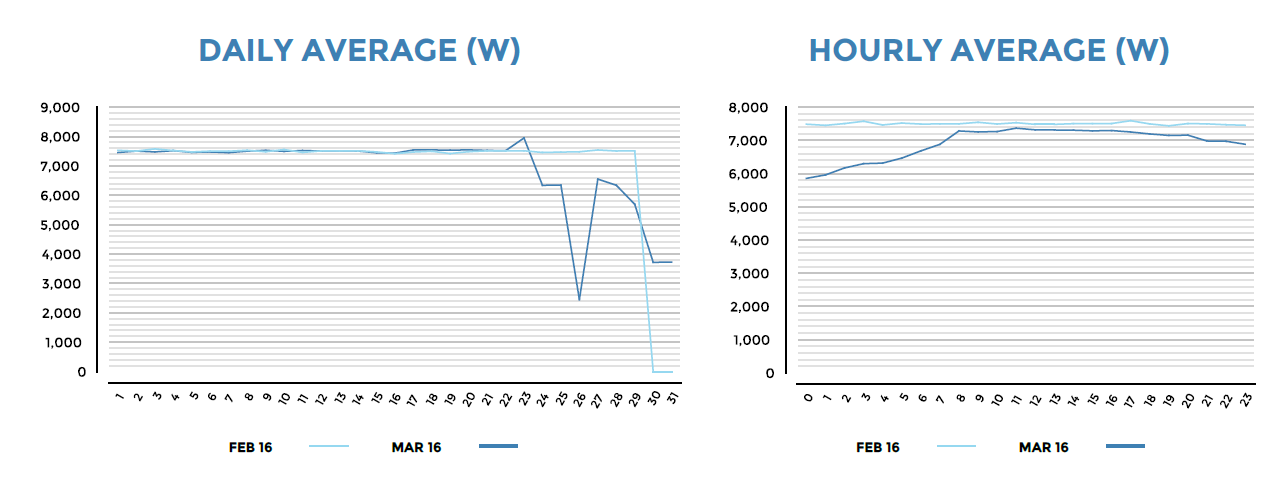
The next two graphs display the average power used per day of the month and per hour of the day. A comparison with the previous month also appears.
Then, the top five most energy-consuming UPSs are displayed, along with consumption distribution by UPS, average consumption and cost by UPS.
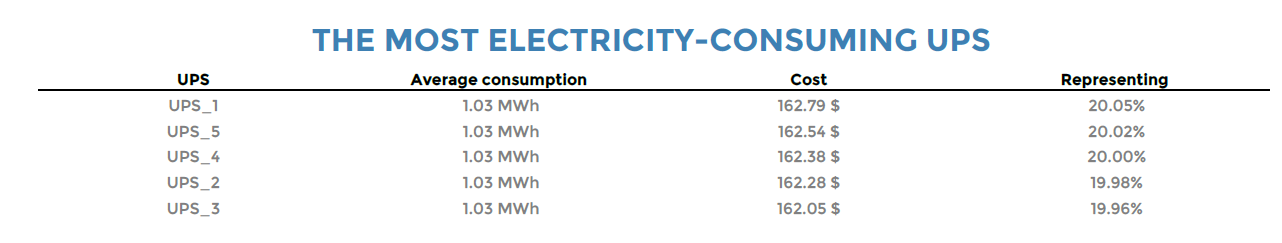
If the host group contains more than five UPSs, only the four most energy-consuming ones will be displayed. A fifth category will include the remaining UPSs.
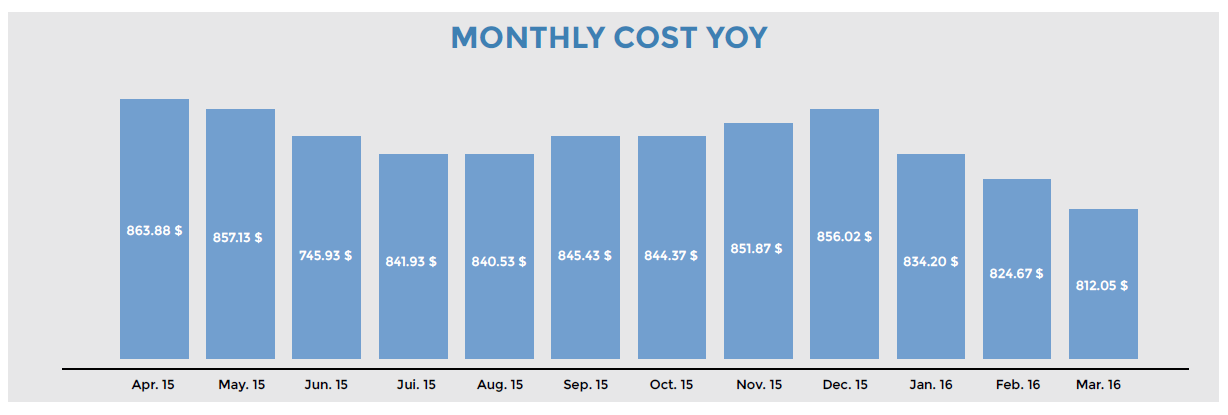
Finally, a graph is shown of the monthly cost year over year (YOY).
Parameters
Parameters required for the report:
- The reporting period
- The following Centreon objects:
| Parameters | type | Description |
|---|---|---|
| Time period | Dropdown list | Select time period. |
| Host group | Dropdown list | Select the host group. |
| Host category | Multi select | Select host categories. |
| Service category | Multi select | Select service categories containing the power indicators. |
| Select metrics to include | Multi select | Select the metric name of the output power. |
| Price KWh | Text | Enter price of the kilowatt-hour. |
Prerequisites
The prerequisites for the report are:
- Monitoring of the output power of the UPSs.
- Creation of a service category containing all the power-output indicators.
- Sufficient historical data for the evolution graphs.
UPS consumption corresponds to the consumption by all hosts connected to the UPS.
Profiling
Host-Detail-2
Description
This report provides detailed statistics on availability, alarms, storage usage, memory and CPU for a given host.
How to interpret the report
The first page displays detailed statistics on a host's availability. The second page shows statistics on the host's performance (CPU and Memory). On the third page, statistics describe storage capacity by partition.
The final page is an appendix displaying the alarms that occurred on the host.
First page
Second page
Third page
1 - Storage statistics on the last day of the reporting period
2 - Storage statistics on the last day of the reporting period
3 - Storage statistics on the last day of each month
4 - Storage statistics on the last day of the reporting period versus the last day of the previous period.
Appendix
Parameters
Parameters required for the report:
- The reporting period
- The following Centreon objects:
| Parameter | Parameter type | Description |
|---|---|---|
| Time period | Dropdown list | Select time period. |
| Interval | Text field | Specify number of months to display in evolution graphs. |
| Host | Dropdown list | Select host. |
| CPU service category | Dropdown list | Select service category containing CPU service(s). |
| CPU metric(s) | Multi Select | Select metric(s) for CPU statistics. |
| Storage service category | Multi Select | Select storage service categories containing the storage service(s). |
| Storage Metric(s) | Multi Select | Specify metric to exclude from the storage statistics. |
| Memory service category | Dropdown list | Select service category containing memory service(s). |
| Memory metric(s) | Multi select | Specify metric(s) to use for memory statistics. |
Prerequisites
For consistency in graphs and statistics, certain prerequisites apply to performance data returned by the plugins. This data must be formatted as follows, preceded by a pipe (|):
output-plugin | metric1=valueunit;warning_treshold;critical_treshold;minimum;maximum metric2=value...
Make sure that the storage and memory plugins return a maximum value, which is required in order to calculate statistics. The unit must be expressed in bytes for storage and memory plugins.
Warning
This report is compatible with the 24x7 time period only. This time period must be configured via the menu "General options | Capacity statistic aggregated by month | Live services for capacity statistics calculation".
Host-Detail-3
Description
This report provides detailed statistics on availability, alarms, storage usage, memory, CPU and traffic for a given host.
How to interpret the report
The first page displays detailed statistics on a host's availability.
The second page shows statistics on the host's performance (CPU and memory).
The third page shows statistics on storage capacity by partition.
The fourth page displays performance statistics for inbound and outbound traffic.
Finally, an appendix lists all the alarms occurring on the host.
First page
Second page
Third page
1 - Storage statistics on the last day of the reporting period
2 - Storage statistics on the last day of the reporting period
3 - Storage statistics on the last day of each month
4 - Storage statistics on the last day of the reporting period versus the last day of the previous period.
Fourth page
Appendix
Parameters
Parameters needed by report are:
- The reporting period
- The following Centreon objects:
| Parameter | Parameter type | Description |
|---|---|---|
| Time period | Dropdown list | Select time period. |
| Interval | Text field | Specify number of months to display in evolution graphs. |
| Host | Dropdown list | Select host. |
| CPU service category | Dropdown list | Select service category containing CPU service(s). |
| CPU metric(s) | Multi Select | Select metric(s) for CPU statistics. |
| Storage service category | Multi Select | Select storage service categories containing the storage service(s). |
| Storage Metric(s) | Multi Select | Specify metric to exclude from the storage statistics. |
| Memory service category | Dropdown list | Select service category containing memory service(s). |
| Memory metric(s) | Multi select | Specify metric(s) to use for memory statistics. |
| Traffic service category | Multi selection | Select service category containing traffic service(s). |
| Traffic In metric | Dropdown list | Select inbound traffic metric. |
| Traffic out metric | Dropdown list | Select outbound traffic metric. |
Prerequisites
For consistency in graphs and statistics, certain prerequisites apply to performance data returned by the plugins. This data must be formatted as follows, preceded by a pipe (|):
output-plugin | metric1=valueunit;warning_treshold;critical_treshold;minimum;maximum metric2=value...
Make sure that the storage, memory and traffic plugins return a maximum value, which is required in order to calculate statistics. The unit must be expressed in bytes for storage and memory plugins and in Kbps for traffic plugins.
Warning
This report is compatible with the 24x7 time period only. This time period must be configured via the "General options > Capacity statistics aggregated by month > Live services for capacity statistics calculation" menu.
Hostgroup-Host-Details-1
Description
The report provides detailed statistics on availability, alarms, storage usage, memory and CPU for all hosts within a host group.
How to interpret the report
For each host, the report is divided into four parts:
The first part displays detailed statistics on a host's availability.
The second part provides statistics on host performance (CPU and memory).
The third part shows statistics on storage capacity by partition.
The final part displays the distribution of inbound and outbound traffic of all interfaces of the host.
First part
Second part
Third part
1 - Storage statistics on the last day of the reporting period
2 - Storage statistics on the last day of the reporting period
3 - Storage statistics on the last day of each month
4 - Storage statistics on the last day of the reporting period versus the last day of the previous period.
Fourth part
Parameters
Parameters required for the report:
- The reporting period
- The following Centreon objects:
| Parameter | Parameter type | Description |
|---|---|---|
| Time period | Dropdown list | Select time period. |
| Interval | Text field | Select number of months to display in evolution graphs. |
| Hostgroup | Dropdown list | Select host group. |
| Host Category | Multi Select | Select host category. |
| CPU service category | Dropdown list | Select service category containing CPU service(s). |
| CPU metric(s) | Multi Select | Select metric(s) to use for CPU statistics. |
| Storage service category | Multi Select | Select storage service categories containing the storage service(s). |
| Storage Metric(s) | Multi Select | Specify metric to exclude from the storage statistics. |
| Memory service category | Dropdown list | Select service category containing memory service(s). |
| Memory metric(s) | Multi select | Select metric(s) for memory statistics. |
| Traffic service category | Dropdown list | Select service category containing traffic service(s). |
| Traffic In metric | Dropdown list | Select inbound traffic metric. |
| Traffic Out metric | Dropdown list | Select outbound traffic metric. |
Prerequisites
For consistency in graphs and statistics, certain prerequisites apply to performance data returned by the plugins. This data must be formatted as follows, preceded by a pipe (|):
output-plugin | metric1=valueunit;warning_treshold;critical_treshold;minimum;maximum metric2=value...
Make sure that the storage, memory and traffic plugins return a maximum value, which is required in order to calculate statistics. The unit must be expressed in bytes for storage and memory plugins and in Kbps for traffic plugins.
Warning
This report is compatible with the 24x7 time period only. This time period must be configured via the General options > Capacity statistics aggregated by month > Live services for capacity statistics calculation menu.
Inventory & Configuration
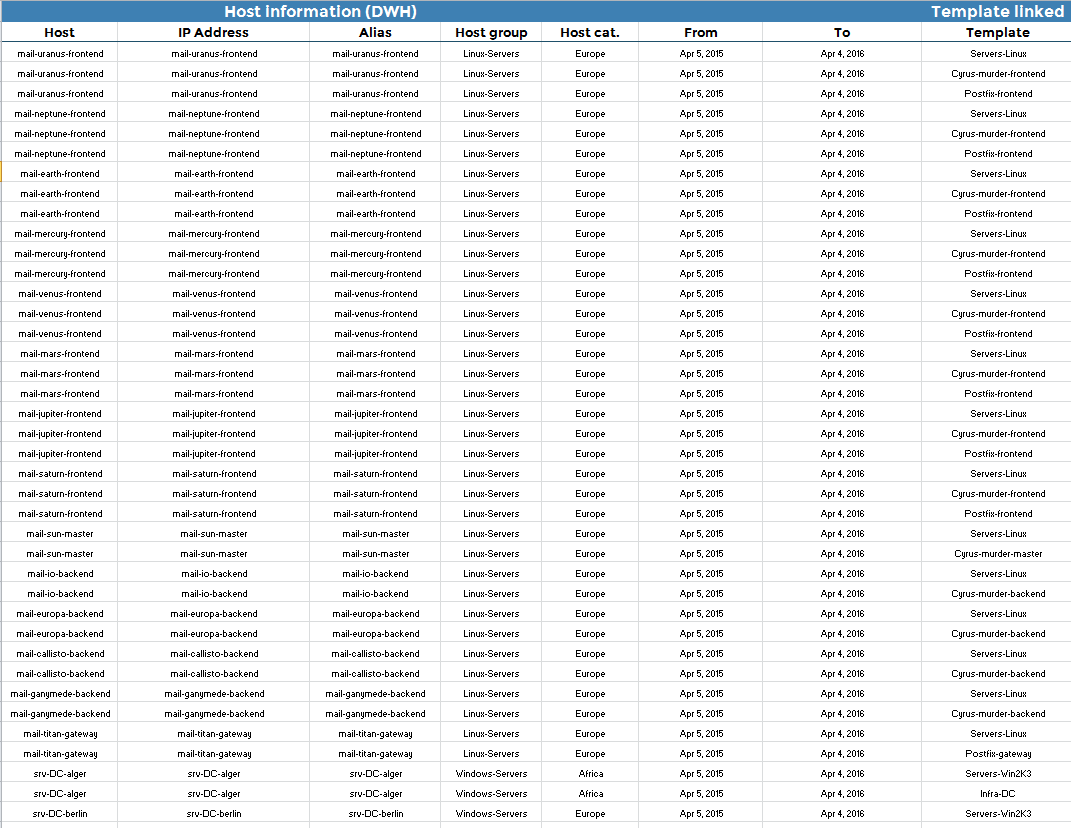
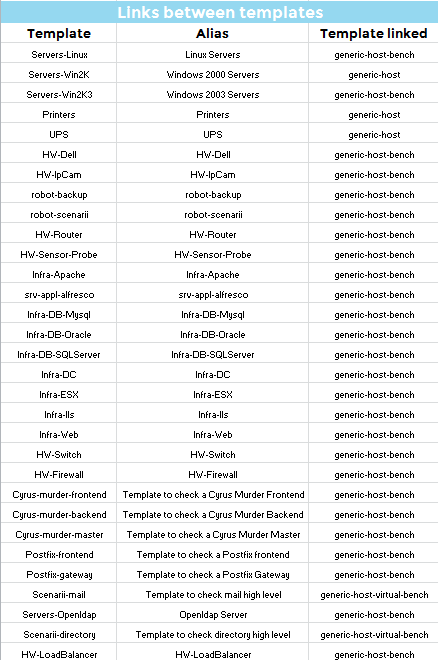
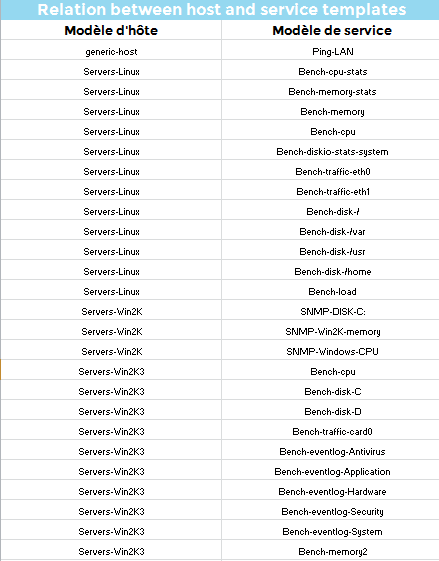
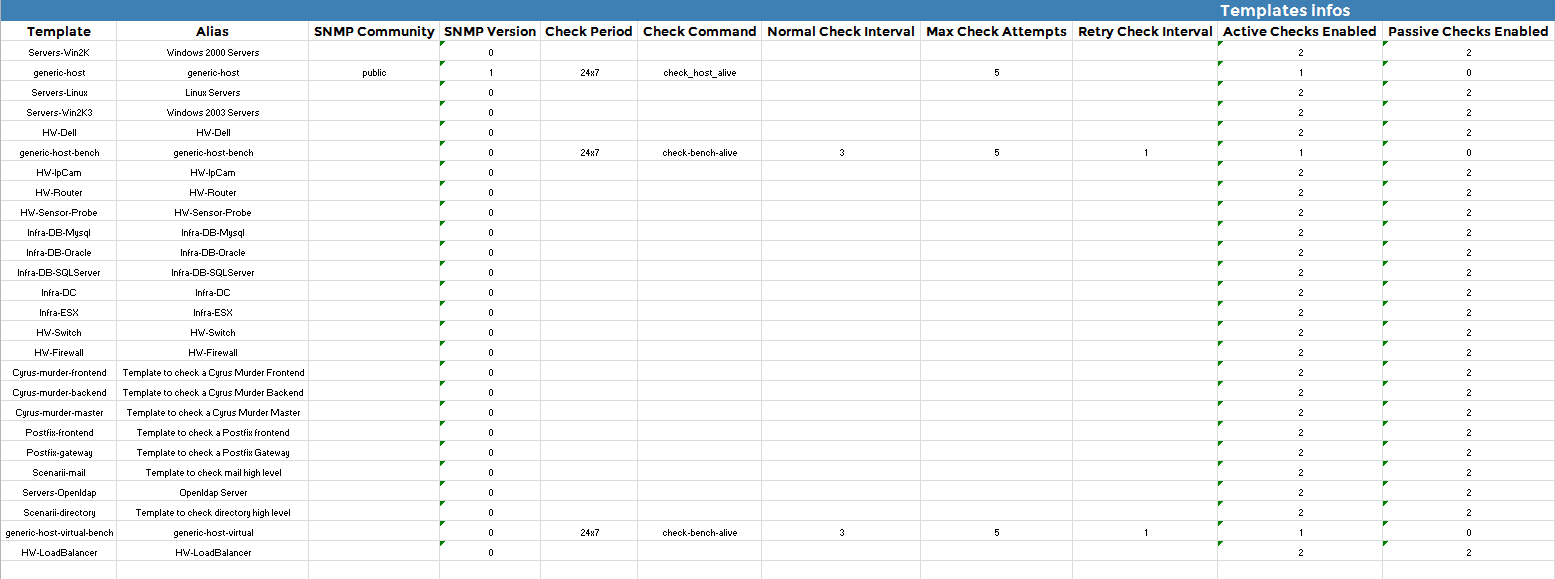
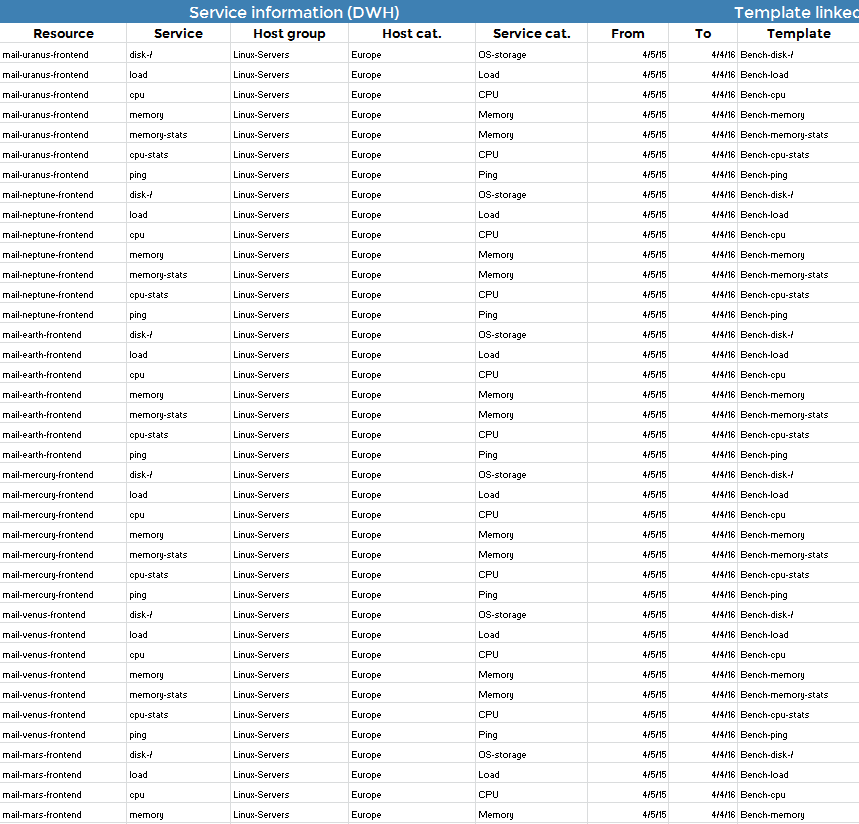
Hostgroups-Host-Templates
Description
This report displays information on the hosts in the reporting datawarehouse, their parent template, relation to groups and categories and creation date. You can filter on host groups and categories.
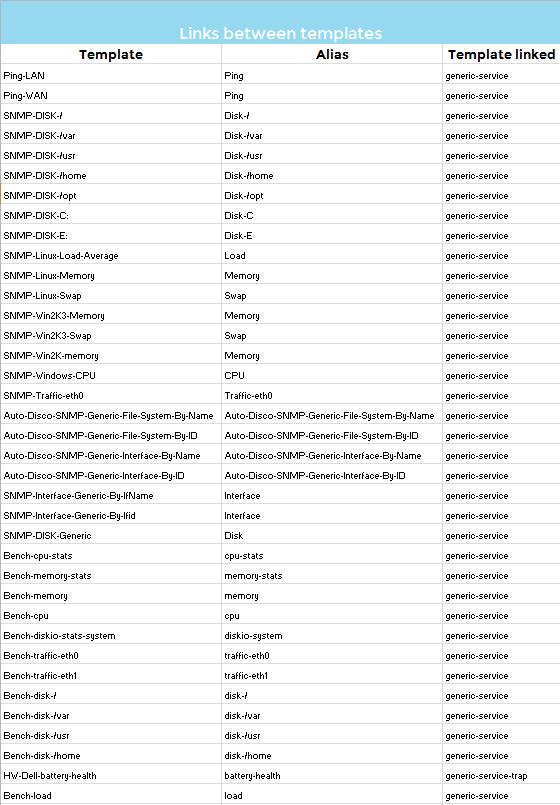
The table below shows the links between host templates:
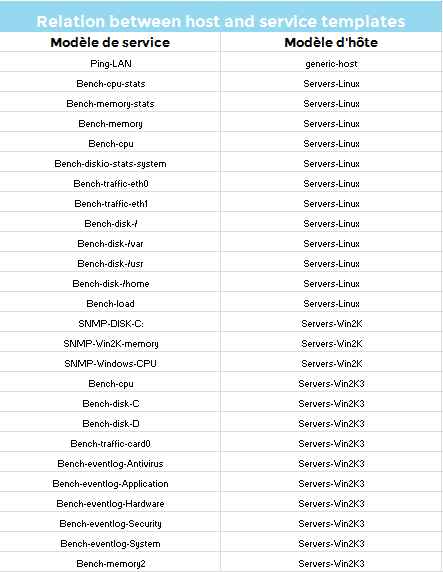
The following table shows the link between service and host templates:
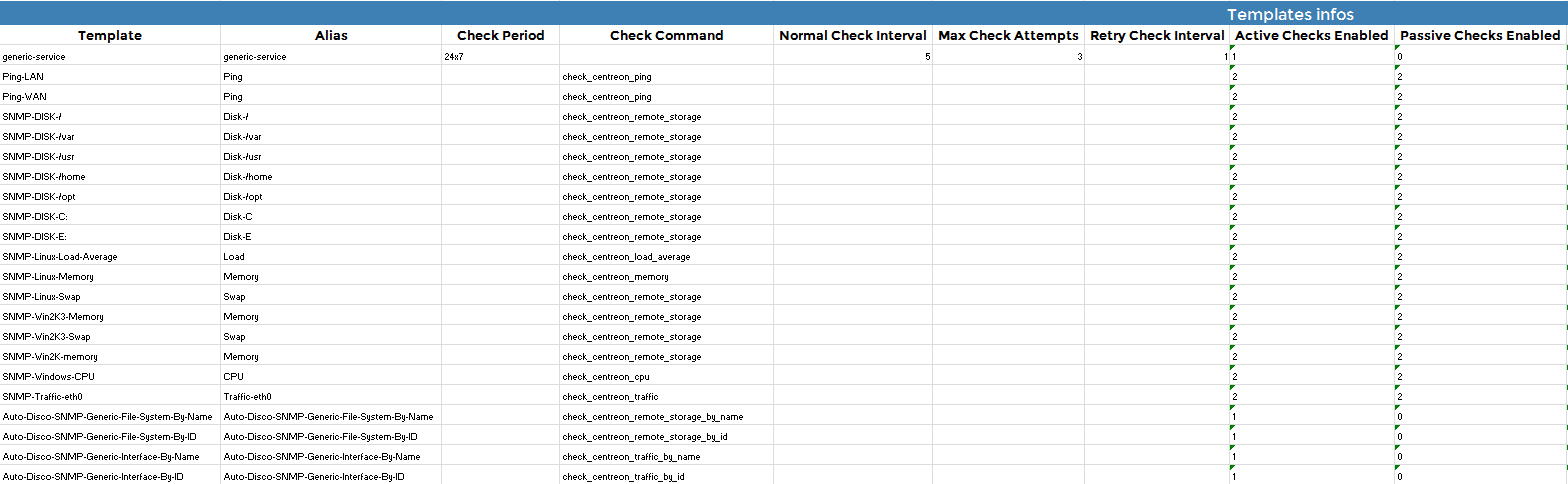
The following table presents an overview of the host templates and their check and notification properties:
Parameters
Parameters required for the report:
- The reporting period
- The following Centreon objects:
| Parameter | Parameter type | Description |
|---|---|---|
| Hostgroups | Multi select | Select host groups. |
| Host Categories | Multi select | Select host categories. |
Hostgroups-Service-Templates
Description
This report displays information on the services in the reporting datawarehouse, their parent template, their relationship with groups and categories, and creation date. You can filter on host groups, host categories and service categories.
The table below shows the links between host templates:
The following table shows the link between host and service templates:
The following table presents an overview of the service templates and their check and notification properties:
Parameters
Parameters expected by the report are:
- The reporting period
- The following Centreon objects:
| Parameter | Parameter type | Description |
|---|---|---|
| Hostgroups | Multi select | Select host groups. |
| Host Categories | Multi select | Select host categories. |
| Service Categories | Multi select | Select service categories. |
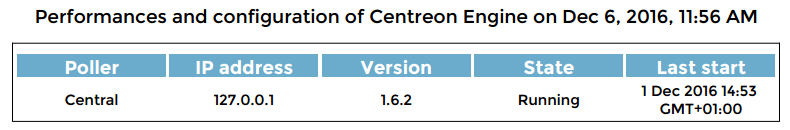
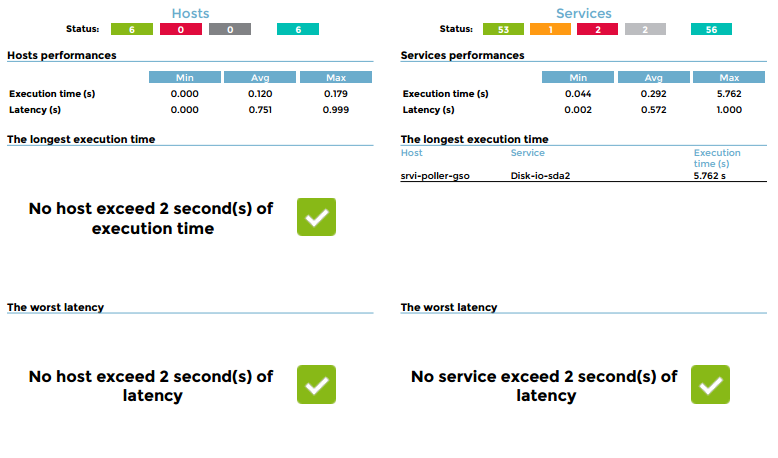
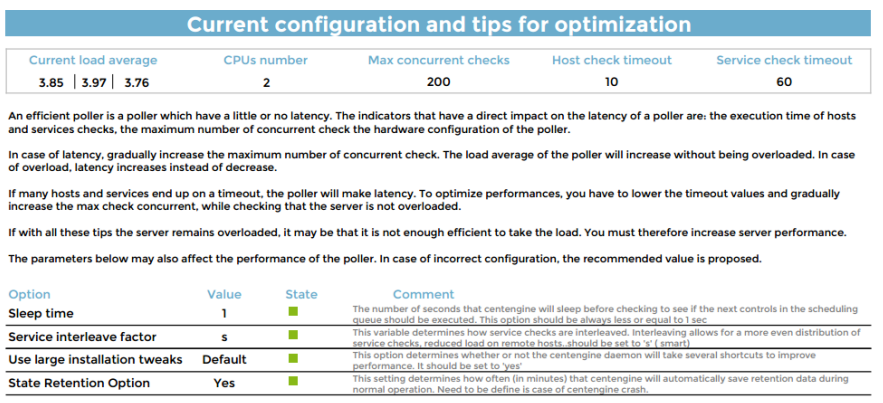
Poller-Performances
Description
This report displays information on the configuration and performance of the Centreon Engine running on a poller.
How to interpret the report
The poller name, IP address, version number and state of the engine, and date of the last restart are displayed in the first part of the report.
The report then shows the status of the hosts and services monitored by the poller.
Statistics on latencies and execution times are presented along with the hosts and services that exceed tolerated thresholds.
Finally, the report displays the current configuration of the Centreon Engine and offers tips to optimize it (in case of performance issues).
Parameters
The data appearing in the report is real-time data.
Parameters required for the report:
- The following Centreon objects:
| Parameter | Type | Description |
|---|---|---|
| Select poller(s) for the report | Radio button | Generate the report on the central poller, the remote pollers, or all pollers. |
| Limit latency (sec) | Text field | Specify latency threshold. Hosts / services exceeding the threshold are listed. |
| Limit execution time (sec) | Text field | Specify execution time threshold. Hosts / services exceeding the threshold are listed. |
Prerequisites
The prerequisites for this report are:
- Monitoring of the load average on the pollers (metric names should be: load1, load5 and load15)
- Monitoring of the CPU on the poller (metric names should contain cpu string with the core number. Example: for a 4 core CPU, metrics can be cpu0,cpu1... or cpu_0,cpu_1...
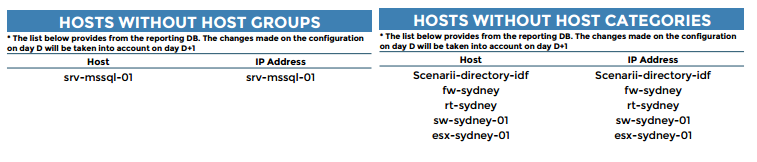
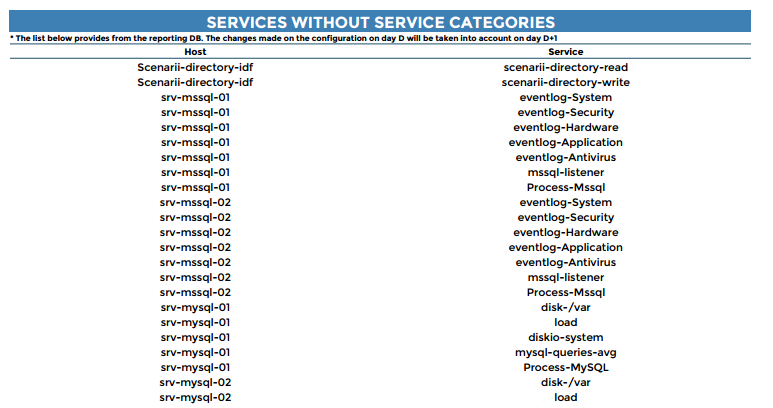
Hosts-not-classified
Description
This report displays all unclassified hosts. Information is represented in two tables:
- One displays all hosts without a host group.
- The second displays all hosts without a host category.
A host without either a host group or a host category will appear in both tables.
Any changes to host classification will appear the day after the change is made.
Parameters
This report requires no parameters.
Prerequisites
None.
Services-not-classified
Description
This report displays all unclassified services. Information is presented in a table.
Any changes to service classification will be appear the day after the change is made.
Parameters
This report requires no parameters.
Prerequisites
None.
Database diagnostics
Content-diagnostic
Description
This report enables you to check whether availability and performance data aggregated by days and months are present in the database.
Color coding is used to display data by host group, host category and time period.
- Green = a value is available
- Red = no value is available
This report does not describe data quality, only data availability.
Parameters
Parameters required for the report:
- The reporting period
- The following Centreon objects:
| Parameter | Parameter type | Description |
|---|---|---|
| Host group | Multi select | Select host group. |
| Service Categories | Multi select | Select service category. |
| Host Categories | Multi select | Select host category. |
| Metrics | Multi select | Specify metrics for filtering. |
Content-diagnostic-availability
Description
This report provides a calendar view of host availability, displaying the following information: availability of each host by day, unavailability and unreachability. This data is shown for each time period and organized by group and category.
Parameters
Parameters required for the report:
- The reporting period
- The following Centreon objects:
| Parameter | Parameter type | Description |
|---|---|---|
| Host group | Drop-down list | Select host group. |
| Hosts Categories | Multi select | Select host categories. |
Content-diagnostic-service-availability
Description
This report provides a calendar view of service availability, displaying the following information: availability for each service by day, warning time and critical time. This data is shown for each time period and organized by group, host category and service category.
Parameters
Parameters required for the report:
- The reporting period
- The following Centreon objects:
| Parameter | Parameter type | Description |
|---|---|---|
| Host group | Drop-down list | Select host group. |
| Hosts Categories | Multi select | Select host categories. |
| Service Categories | Multi select | Select service categories. |
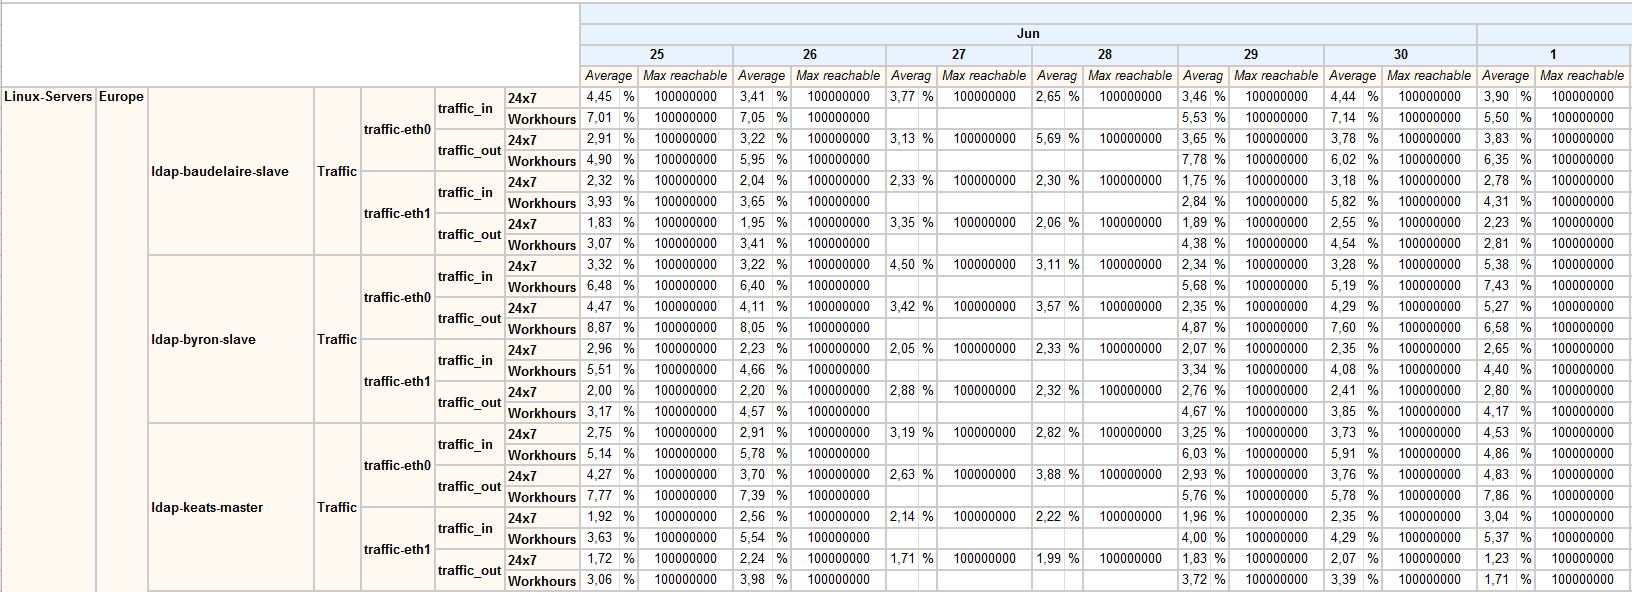
Content-diagnostic-performance
Description
This report provides a calendar view of average values by metrics and time periods. It also indicates the maximum value reachable for each metric. Data is organized by group, host and service categories.
Parameters
Parameters required for the report:
- The reporting period
- The following Centreon objects:
| Parameter | Parameter type | Description |
|---|---|---|
| Host group | Drop-down list | Select host group. |
| Hosts Categories | Multi select | Select host categories. |
| Service Categories | Multi select | Select service categories. |
| Metrics | Multi select | Select metrics to include |
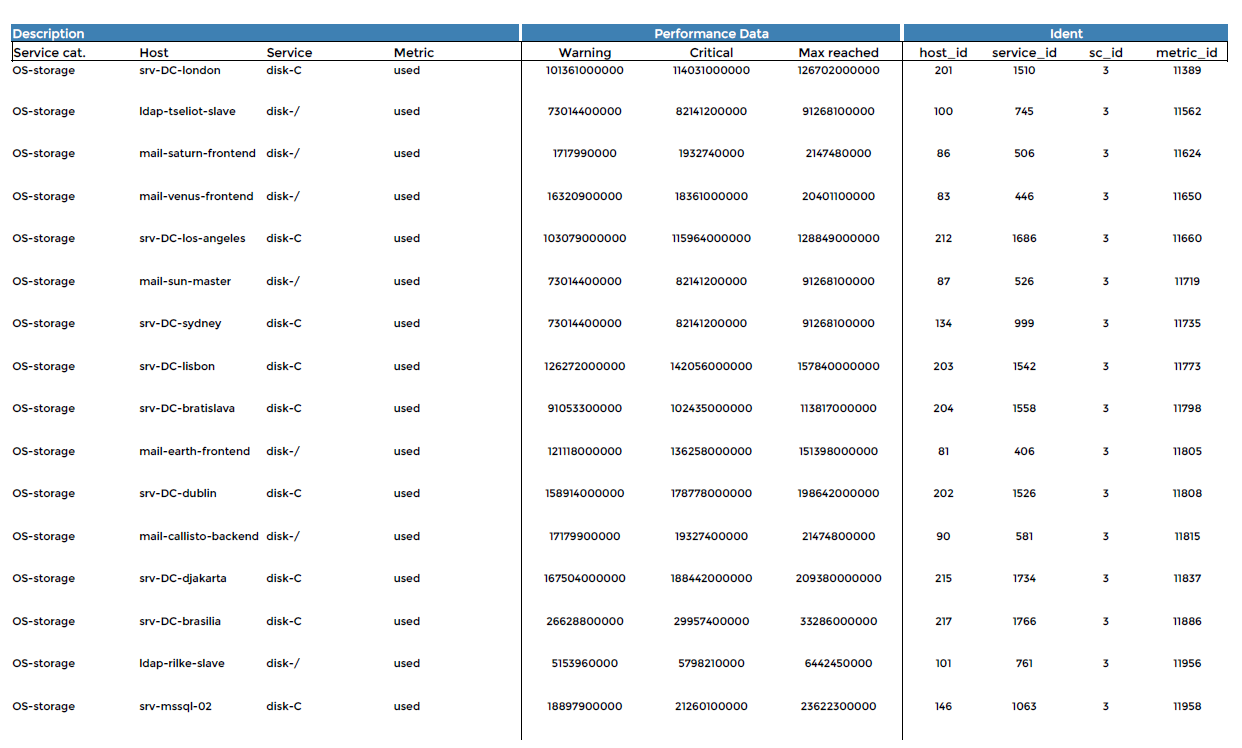
Metric-integrity-check
Description
This report checks the compatibility between the plugins/metrics and the MBI performance reports. It allows you to quickly identify incompatible services and to update the plugins.
How to interpret the report
If a warning is displayed on a line:
- Warning and Critical thresholds are not set.
- The maximum value was not returned by the plugin.
Parameters
Parameters required for the report:
- The reporting period
- The following Centreon objects:
| Parameter | Parameter type | Description |
|---|---|---|
| Service Categories | Multi select | Select service categories. |
| Metrics | Multi select | Select metrics to include |
Report translation
Centreon MBI can generate reports in two languages: English and French. Other target languages are possible if you create the appropriate translation files.
Translation files require a .properties extension. They are stored in the /usr/share/centreon-bi/Resources/translation directory and classified by type in subdirectories.
The English-language files are named xxx.properties and the French, xxx_fr_FR.properties.
If you need to generate reports in a language other than English or French, you should make a copy of all xxx.properties, giving the files a suffix corresponding to the locale of your target language.
For example, a German translation requires the file with the suffix xxx_de_DE.properties; for a Spanish translation it would be xxx_es_ES.properties.
Then, translate all the English content in these new files into the appropriate target language.
Even if you want to translate only a few reports, you must still translate the global translation files using the method described above. These files are:
- units.properties
- calendar.properties
- common.properties
- master-page.properties
Then translate the file or files for the report family you require.
These files are stored in
/usr/share/centreon-bi/Resources/translation/component/.
When the new xxx.properties files have been translated, go to your Centreon MBI interface, edit a job, and then click the refresh button next to the language selection. The new language should appear in the list.
Select the desired language and generate the report.
Warning
Because certain languages are more verbose than others, translated text strings that are excessively long may affect the formatting (design) of the report.