MBI Widgets
The following Centreon MBI widgets are available in Dashboards:
- Business Activity availability
- Business Activity Availability History
- Hostgroup Availability History
- Metric Capacity planning
MBI widgets are also used in Centreon custom views. This means you can use custom views to create real-time AND reporting statistics (e.g., for availability, applications, and performance).
A list of available widgets appears below.
To update ACLs, click Update Resources ACL in the Report Parameters tab under the Centreon MBI general options.
Availability & events
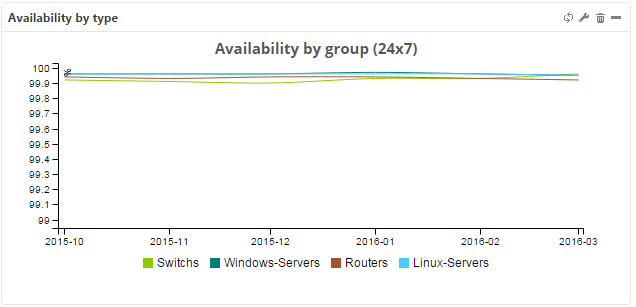
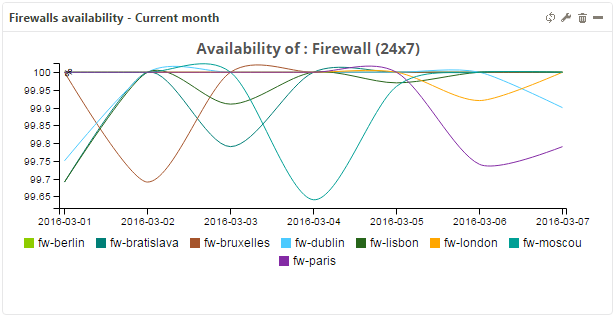
Hostgroups availability by hostgroups by month
Description
This widget displays the availability of hosts belonging to a host group, by month.
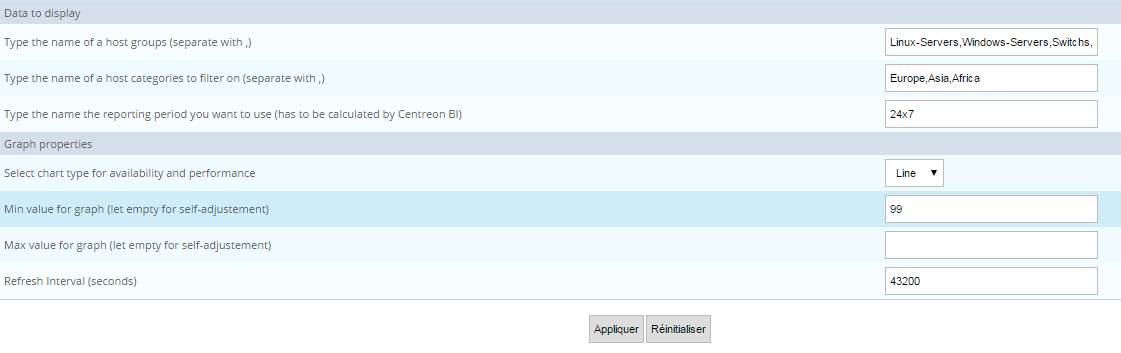
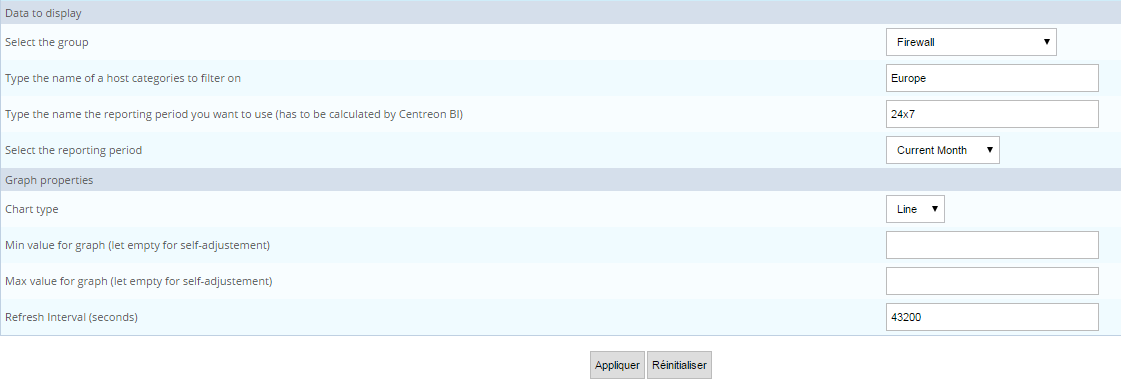
Parameters
Menu description
- Select the group: Specify host group for displaying statistics.
- Type the name of host categories to filter on: Indicate one or more host categories. Separate multiple entries by a comma.
- Type the name of the reporting period you want to use (must be calculated by Centreon BI): Make sure the reporting period is preconfigured in MBI.
- Chart type: Indicate type of graph.
- Min value for graph (leave empty for self-adjustment): Minimum value for Y-axis height.
- Max value for graph (leave empty for self-adjustment): Maximum value for Y-axis height.
- Refresh Interval (seconds): Sets automatic refresh time for widgets.
Example
Hostgroup availability by host by day
Description
This widget displays the availability of hosts belonging to a host group, by day.
Parameters
Menu description
- Select the group: Specify host group for displaying statistics.
- Type the name of host categories to filter on: Indicate one or more host categories. Separate multiple entries by a comma.
- Type the name of the reporting period you want to use (must be calculated by Centreon MBI): Make sure the reporting period must be preconfigured in MBI.
- Select the reporting period.
- Chart type: Indicate type of graph.
- Min value for graph (leave empty for self-adjustment): Minimum value for Y-axis height.
- Max value for graph (leave empty for self-adjustment): Maximum value for Y-axis height.
- Refresh Interval (seconds): Sets automatic refresh time for widgets.
Example
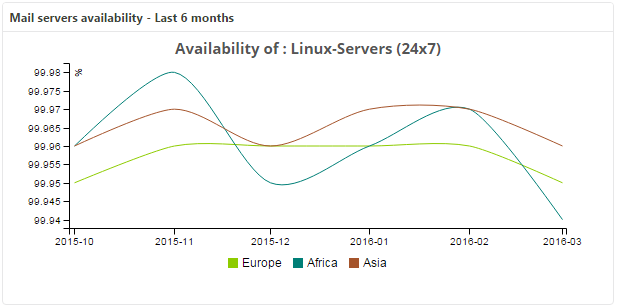
Hostgroup availability by host categories by month
Description
This widget displays the availability of hosts belonging to a host group, segmenting the hosts by category and by month.
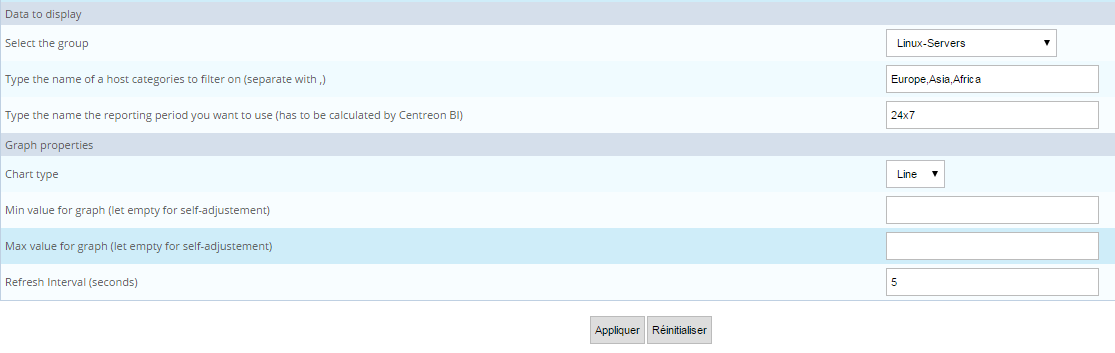
Parameters
Menu description
- Select the group: Specify host group for displaying statistics.
- Type the name of host categories to filter on: Indicate one or more host categories. Separate multiple entries by a comma.
- Type the name of the reporting period you want to use (must be calculated by Centreon BI): Make sure the reporting period is preconfigured in MBI.
- Chart type: Indicate type of graph.
- Min value for graph (leave empty for self-adjustment): Minimum value for Y-axis height.
- Max value for graph (leave empty for self-adjustment): Maximum value for Y-axis height.
- Refresh Interval (seconds): Sets automatic refresh time for widgets.
Example
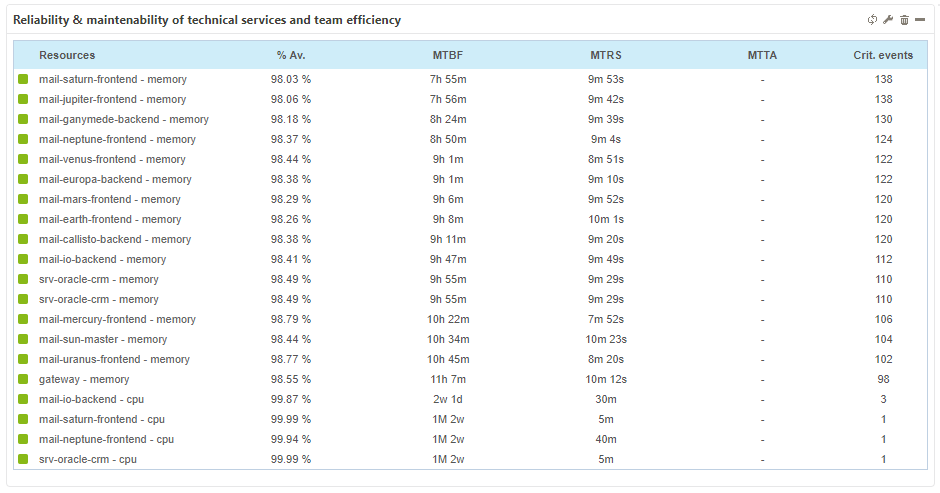
MTBF and MTRS by service
Description
This widget provides information on the reliability (MTBF) and maintainability (MTRS) of your services as well as the level of your team's efficiency when managing downtime (MTTA). Data is shown as a top N aggregate statistic. Additional information such as current status, availability, number of events and last state change are also provided to help in decision-making.
- MTBF (mean time between failures) represents the average duration between two DOWN states. The longer the duration, the more reliable the service.
- MTRS (mean time to restore service) is the average duration between two failures. Services with good maintainability have a short MTRS.
- MTTA (mean time to acknowledge) is the average duration for acknowledging DOWN states. The average is calculated only on acknowledged events.
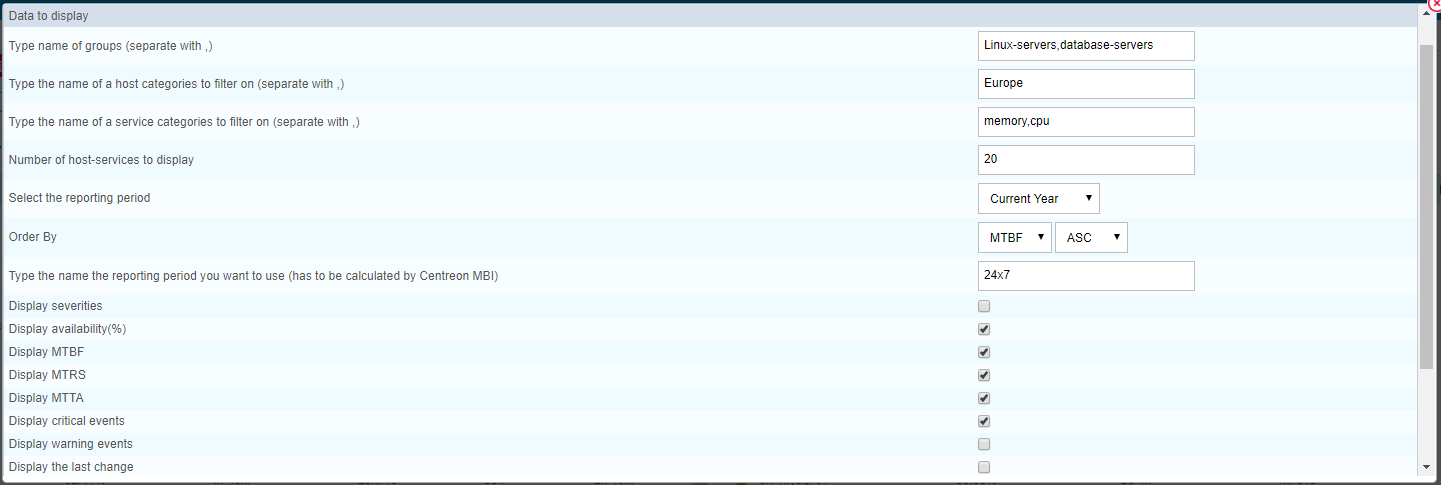
Parameters
Menu description
- Type name of group(s) (separate with ,): Indicate host group for displaying statistics.
- Type the name of host categories to filter on (separate with ,): Indicate one or more host categories.
- Type the name of service categories to filter on (separate with ,): Specify one or more service categories.
- Number of host-services to display.
- Select the reporting period.
- Order By MTBF, MTRS or MTTA.
- Type the name of the reporting period you want to use (has to be calculated by Centreon MBI): Make sure the reporting period must be preconfigured in MBI.
- Display severities/availability/MTBF/MTRS/MTTA/critical events/warning events/last change: Shows or hides these columns.
- Refresh Interval (seconds): Sets automatic refresh time for widgets.
Example
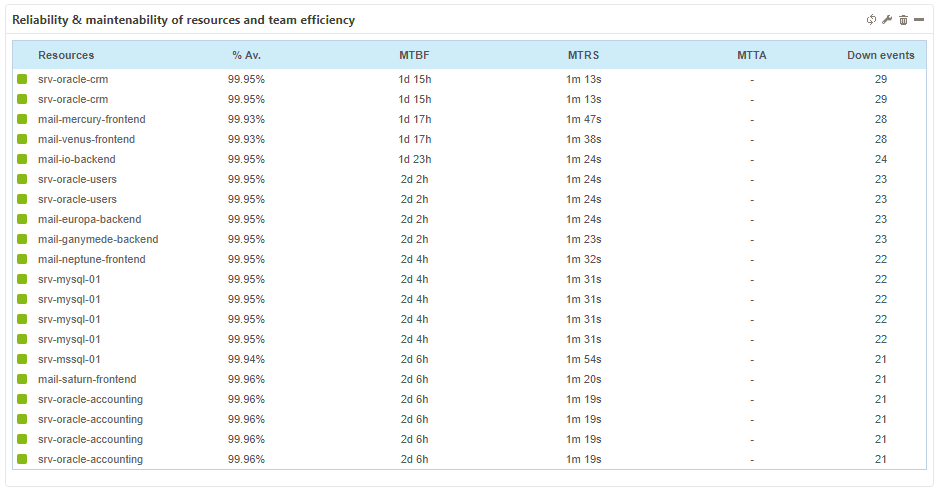
MTBF and MTRS by Host
Description
This widget provides information on the reliability (MTBF) and maintainability (MTRS) of your hosts as well as the level of your team's efficiency when managing downtime (MTTA). Data is shown as a top N aggregate statistic. Additional information such as current status, availability, number of events and last state change are also provided to help in decision-making.
- MTBF (mean time between failures) represents the average duration between two DOWN states. The longer the duration, the more reliable the host.
- MTRS (mean time to restore service) is the average duration between two failures. Hosts with good maintainability have a short MTRS.
- MTTA (mean time to acknowledge) is the average duration for acknowledging DOWN states. The average is calculated only on acknowledged events.
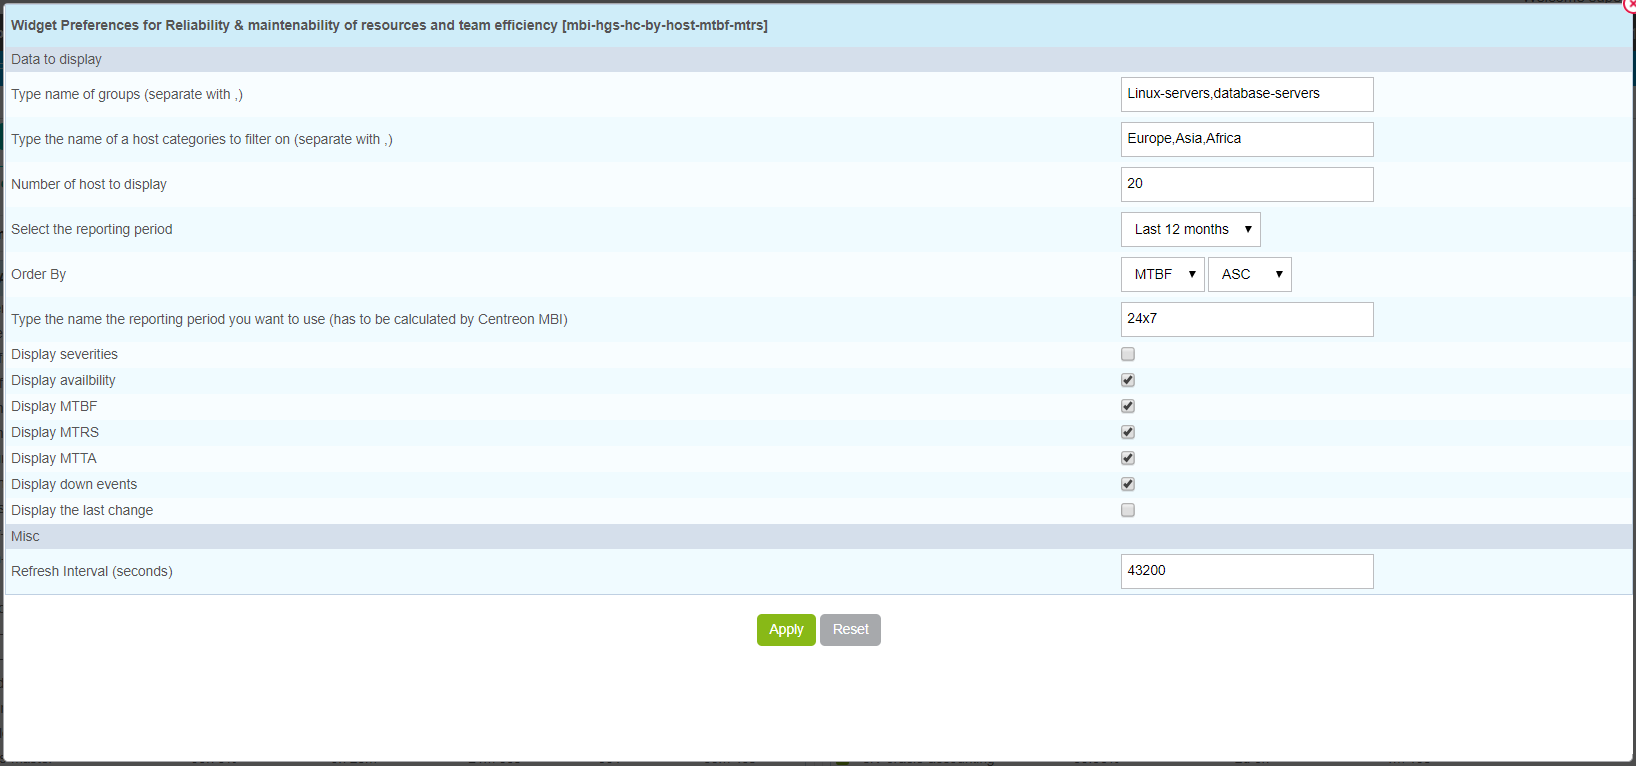
Parameters
Menu description
- Select the group: Specify host group for displaying statistics: Separate multiple entries by a comma.
- Type the name of host categories to filter on: Indicate one or more host categories. Separate multiple entries by a comma.
- Number of hosts to display: Maximum number of hosts displayed.
- Select the reporting period.
- Order By MTBF, MTRS or MTTA.
- Type the name of the reporting period you want to use (has to be calculated by Centreon MBI): Make sure the reporting period must be preconfigured in MBI.
- Display severities/availability/MTBF/MTRS/MTTA/down events/last change: Shows or hides these columns.
- Refresh Interval (seconds): Sets automatic refresh time for widgets.
Example
Capacity & Performance
Services that you want to use in the following widgets need to be categorized at least in one service category, for at least one day.
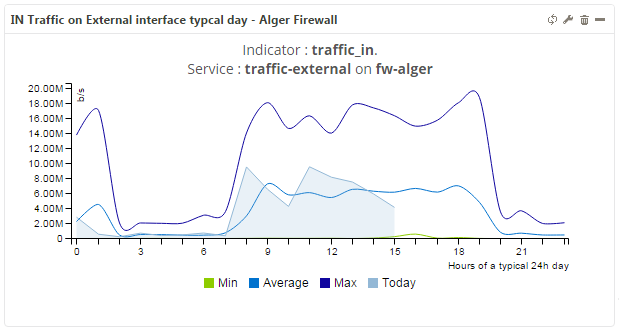
Typical metric performance day
Description
This widget displays a typical 24-hour day of activity for a particular metric.
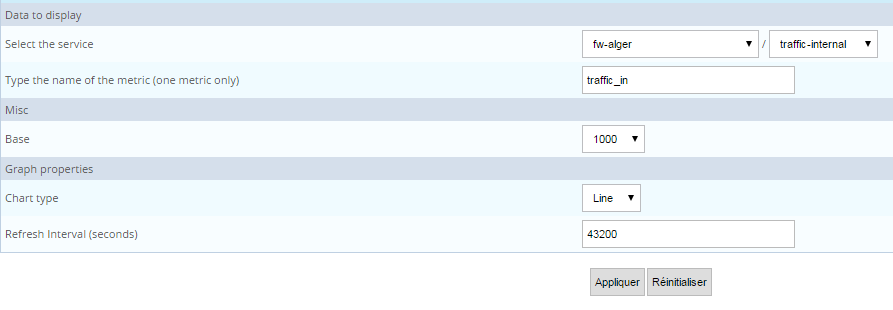
Parameters
Menu description
- Select the service: Select the host followed by the service.
- Type the name of the metric (one metric only): Enter metric pertaining to a service.
- Base: Base for division (1000 or 1024).
- Chart type: Indicate type of graph.
- Refresh Interval (seconds): Sets automatic refresh time for widgets.
Example
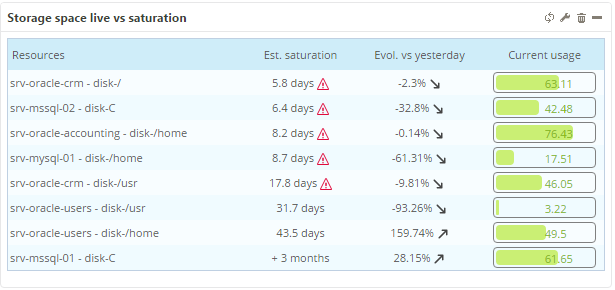
Storage list near saturation
Description
This widget displays storage space approaching saturation. It also shows the real-time value and the evolution since the previous day. The calculation compares the storage values J-X and J. Only used storage space that increases is shown in this widget.
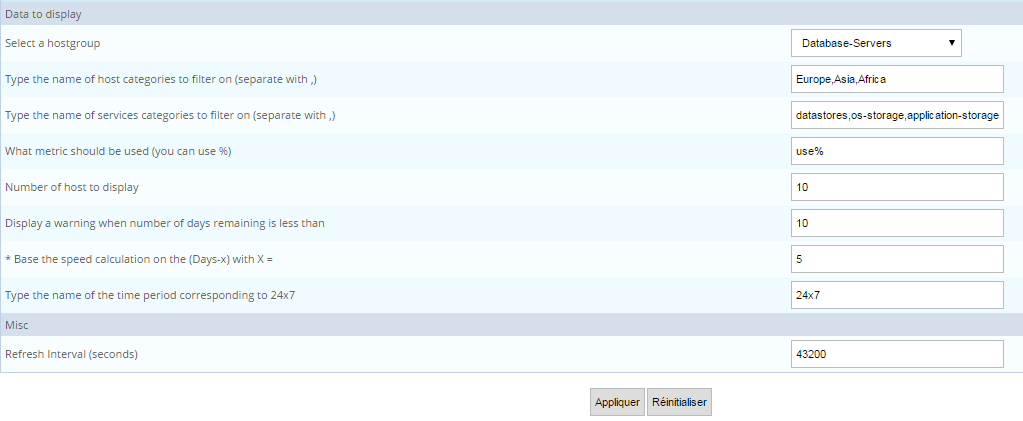
Parameters
Description
- Select a hostgroup: Select a host group containing storage services.
- Type the name of a host category to filter on (separate with ,).
- Type the name of a service category to filter on (separate with ,).
- What metric should be used (you can use %): Example:
[used]()% - Number of hosts to display: Specify for number of lines in table.
- Display a warning when number of days remaining is less than N: Estimate the number of days before saturation. A warning icon appears before reaching this "security" threshold.
- Base the speed calculation on the (Days -x) with X =: Specify day to compare to current day for calculating the evolution of speed and saturation.
- Type the name of the time period corresponding to 24x7: Indicate time period in hours/days.
- Refresh Interval (seconds): Sets automatic refresh time for widgets.
Example
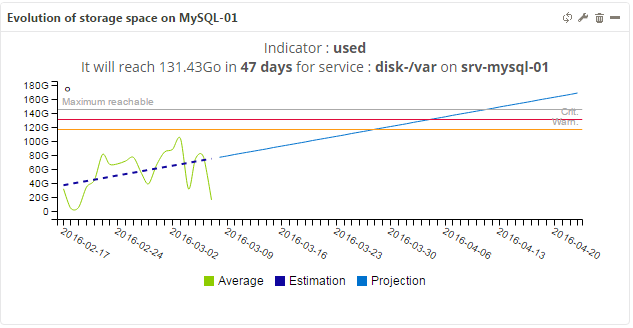
Metric capacity planning
Description
This widget displays the future evolution of a metric in relation to its history using linear regression.
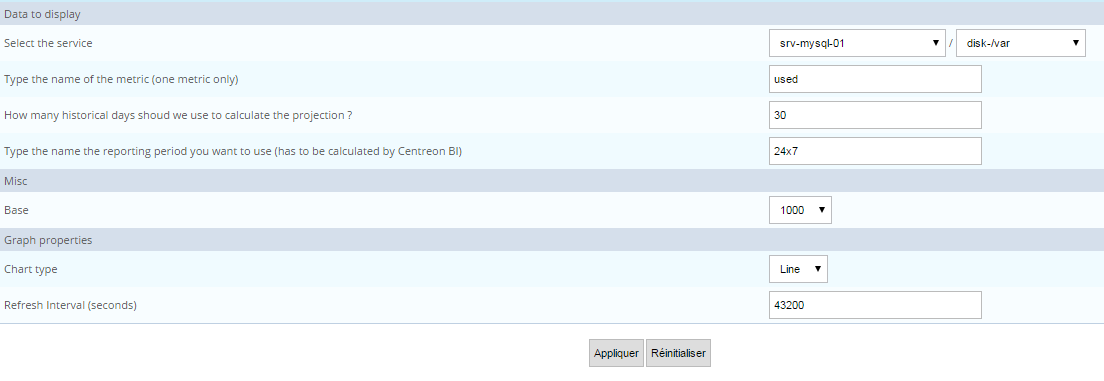
Parameters
Menu description
- Select the service: Select the host followed by the service.
- Type the name of the metric (one metric only): Enter metric pertaining to a service.
- How many historical days should we use to calculate the projection: This period should show the evolution of the metric.
- Type the name of the reporting period you want to use (must be calculated by Centreon BI).
- Base: Base for division (1000 or 1024).
- Chart type: Indicate type of graph for availability and performance.
- Refresh Interval (seconds): Sets automatic refresh time for widgets.
Example
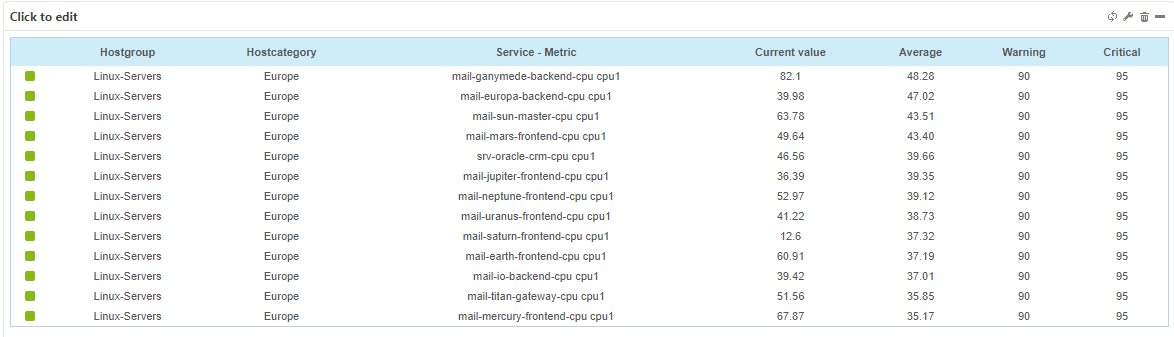
Hostgroups performance metric - TOP X
Description
This widget displays a rating of top performance data by metric (i.e., current value, average, minimum, maximum, thresholds) for groups and categories.
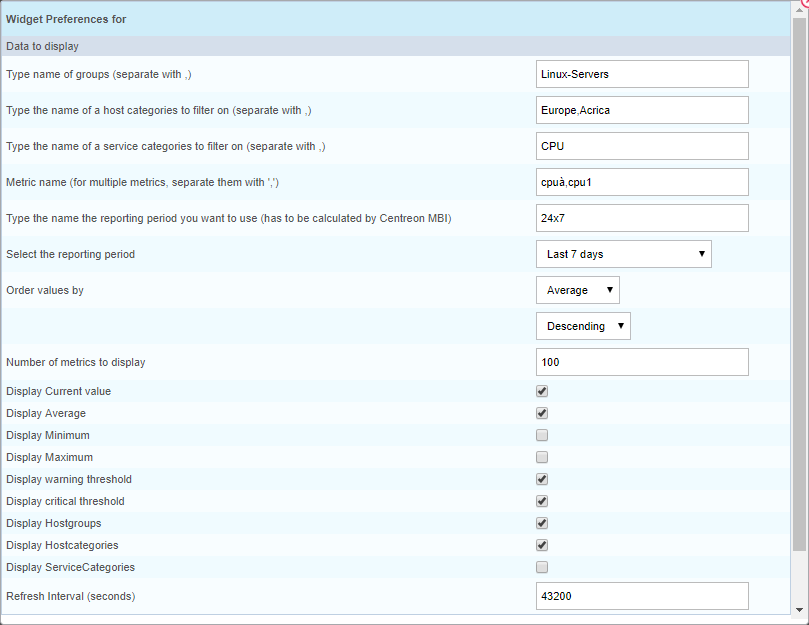
Parameters
Menu description
- Type the names of groups (separate with ,).
- Type the name of a host category to filter on (separate with ,).
- Type the name of a service category to filter on (separate with ,).
- Metric name (for multiple metrics, separate them with a comma).
- Type the name of the reporting period you want to use (must be calculated by Centreon MBI): Make sure the reporting period is preconfigured in MBI.
- Select the reporting period.
- Order values by: average, minimum or maximum, ascending or descending.
- Number of metrics to display: Top N to display in terms of metrics.
- Display Current value: Show / hide the column.
- Display Average: Display / hide the column.
- Display Minimum: Display / hide the column.
- Display Maximum: Show / hide the column.
- Display warning threshold: Show / hide the column.
- Display critical threshold: Show / hide the column.
- Display Hostgroups: Show / hide the column.
- Display Hostcategories: Show / hide the column.
- Display ServiceCategories: Show / hide the column.
- Refresh Interval in seconds: Sets automatic refresh time for widgets.
Example
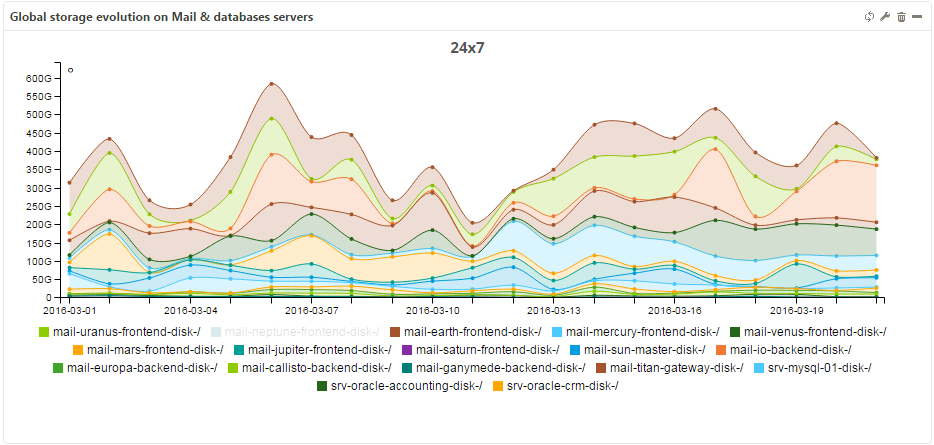
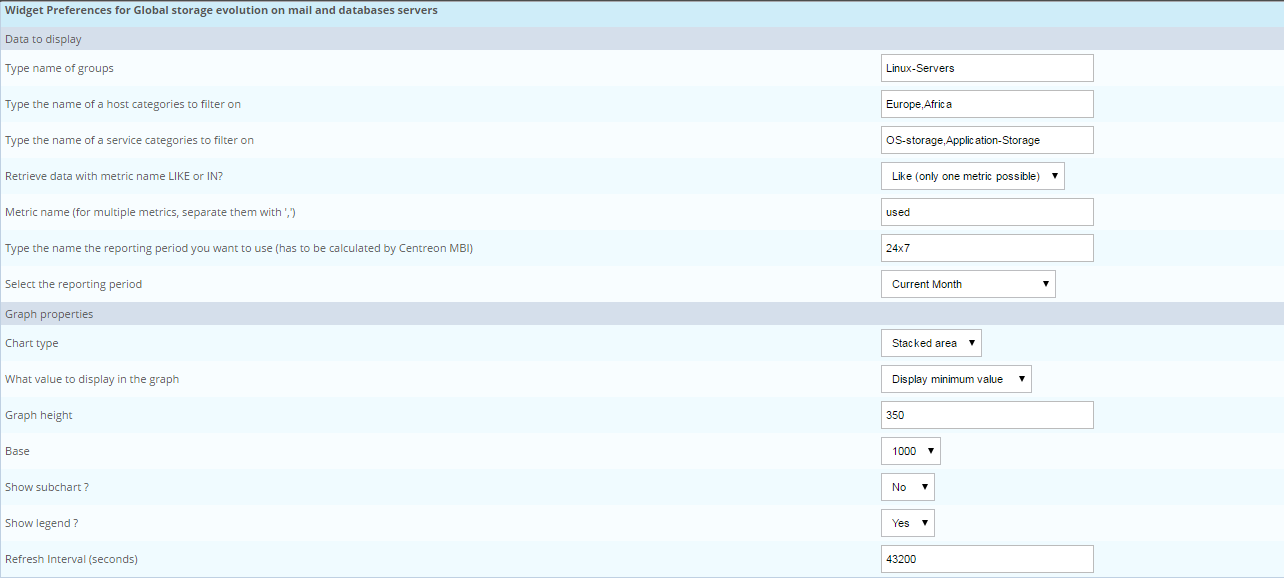
Hostgroups, categories performance analysis by day
Description
This widget displays performance data (minimum, average or maximum) by day over a defined period for groups and categories.
Parameters
Menu description
- Type name of groups: Separate multiple entries by a comma.
- Type the name of a host category to filter on: Separate multiple entries by a comma.
- Type the name of a service category to filter on: Separate multiple entries by a comma.
- Retrieve data with metric name LIKE or IN?: Use this method to filter on metric name.
- Metric name (for multiple metrics, separate them with a comma): Type the name of the metric (if filter mode = like) or multiple metrics (if mode = IN).
- Type the name of the reporting period you want to use (has to be calculated by Centreon MBI): Make sure the reporting period is preconfigured in MBI.
- Select the reporting period.
- What value to display in the graph: Use minimum, average or maximum value.
- Graph height: Graph might need to be resized to include caption.
- Base: Controls conversion to display G, M, K, etc.
- Show subchart?: Show or hide the subchart for zooming in.
- Show legend?: Show or hide the caption.
- Refresh Interval (seconds): Sets automatic refresh time for widgets.
Example
Business activity monitoring
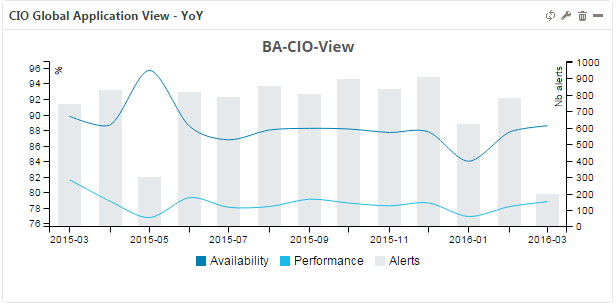
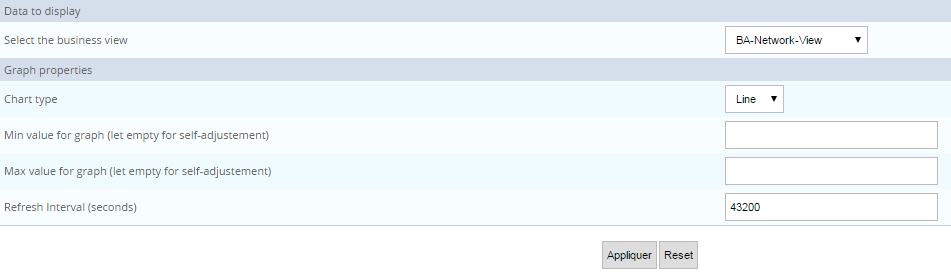
Business View Availability,Performance and Alerts by month
This widget only works with Centreon BAM data.
Description
This widget presents a graph showing the availability, performance and alerts of one Business View (logical grouping of BAs) by month over the last 12 months.
Parameters
Menu description
- Select a business view from Centreon BAM.
- Select the reporting period.
- Chart type: Indicate type of graph.
- Min value for graph (leave empty for self-adjustment): Minimum value for Y-axis height.
- Max value for graph (leave empty for self-adjustment): Maximum value for Y-axis height.
- Refresh Interval (seconds): Sets automatic refresh time for widgets.
Example
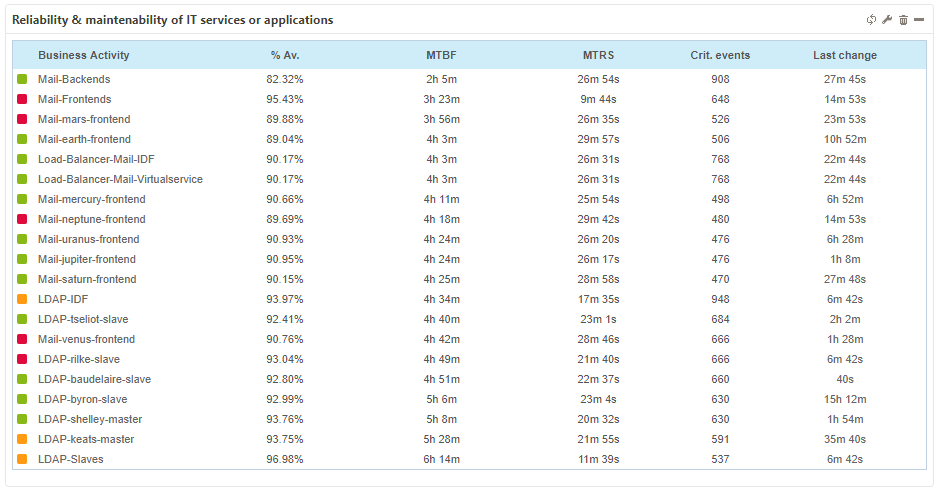
Business Application MTBF & MTRS
This widget only works with Centreon BAM data.
Description
This widget provides information on the reliability (MTBF) and maintainability (MTRS) of your critical IT services and applications, represented in Centreon BAM. Additional information such as current status, availability, number of events or last state change are also provided to help in decision-making. Data is shown as a top N aggregate statistic.
- MTBF (mean time between failures) represents the average duration between two DOWN states. The longer the duration, the more reliable the host.
- MTRS (mean time to restore service) is the average duration between two failures. Hosts with good maintainability have a short MTRS.
Parameters
Menu description
- Select an application: Select a business view. If left empty, this field retrieves all BAs (filtered by the ACLs).
- Number of business activities to display.
- Select the reporting period.
- Order By: Sort the result by MTBF or MTRS.
- Type the name of the reporting period you want to use (must be calculated by Centreon MBI): Make sure the reporting period must be preconfigured in MBI: If this field is left empty the default reporting time period for each BA applies.
- Display XXXXX: Shows or hides the specified columns.
- Refresh Interval (seconds): Sets automatic refresh time for widgets.
Example

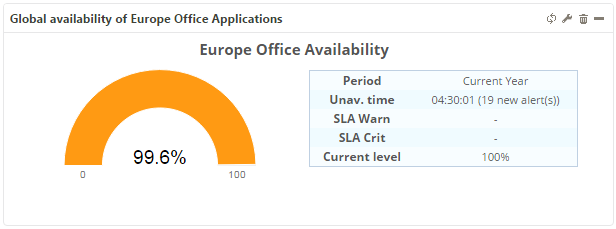
Business Application Availability (Gauge)
This widget only works with Centreon BAM data.
Description
This widget displays the availability of one BA, its SLAs (if available) for the selected reporting period and the current BA level. If you select a reporting period for which there is no data, such as "Current month" on the first day of the month, the current available level is displayed on the graph.
Parameters
Menu description
- Select an application: Select a BA from Centreon BAM.
- Select the reporting period.
- Refresh Interval (seconds): Sets automatic refresh time for widgets.
Example
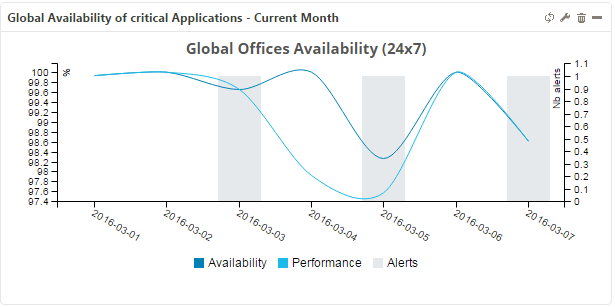
Business Application Availability, Performance and Alerts by day
This widget only works with Centreon BAM data.
Description
This widget presents a graph showing the availability, performance and alerts of one BA per day.
Parameters
Menu description
- Select an application: Select a BA from Centreon BAM.
- Select the reporting period.
- Min value for graph (leave empty for self-adjustment): Minimum value for Y-axis height.
- Max value for graph (leave empty for self-adjustment): Maximum value for Y-axis height.
- Refresh Interval (seconds): Sets automatic refresh time for widgets.
Example
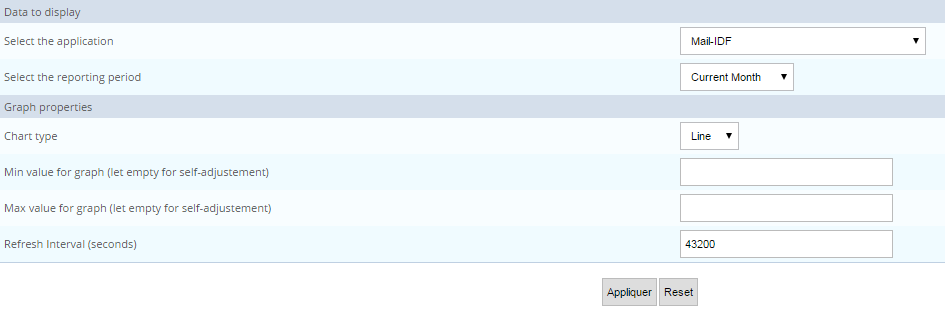
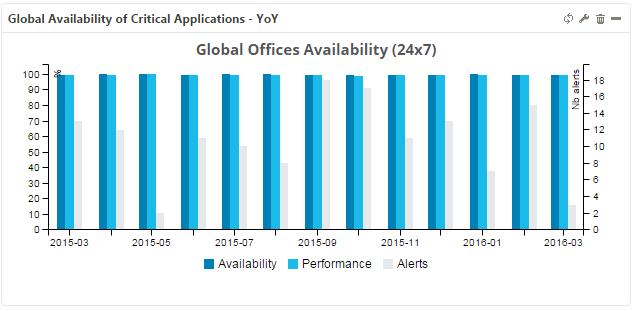
Business Application Availability,Performance and Alerts by month
This widget only works with Centreon BAM data.
Description
This widget presents a graph showing the availability, performance and alerts of one BA per month over the last 12 months.
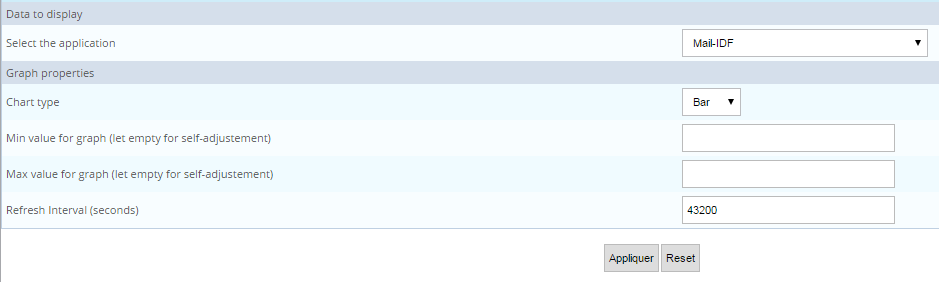
Parameters
Menu description
- Select an application: Select a BA from Centreon BAM.
- Select the reporting period.
- Min value for graph (leave empty for self-adjustment): Minimum value for Y-axis height.
- Max value for graph (leave empty for self-adjustment): Maximum value for Y-axis height.
- Refresh Interval (seconds): Sets automatic refresh time for widgets.
Example