Monitor your first host
Basic principles of monitoring
Before starting to monitor, let's take a look at some basic concepts:
- A host is any device that has an IP address and that one wishes to monitor. For example, a physical server, a virtual machine, a temperature probe, an IP camera, a printer or a storage space.
- A service is a check point, or indicator, to be monitored on a host. This can be the CPU usage rate, temperature, motion detection, bandwidth usage rate, disk I/O, and so on.
- In order to collect each indicator value, monitoring plugins are used which are periodically executed by a collection engine called Centreon Engine.
- To be executed, a plugin needs a set of arguments that define, for example, which host to connect to or through which protocol. The plugin and its associated arguments form a command.
For example, to monitor a host with Centreon is to configure all the commands needed to measure the desired indicators, and then deploy that configuration to the collection engine so that these commands are run periodically.
Nevertheless, to drastically simplify the configuration, we will rely on monitoring templates:
- A host template defines the configuration of the indicators for a given type of equipment.
- It relies on service templates that define the configuration of the commands needed to collect these indicators.
- Centreon provides downloadable Plugins Packs to install on its monitoring platform: each Plugin Pack includes host and services templates to configure the monitoring of a particular device in a few clicks.
This quick start guide proposes to install the monitoring templates supplied free of charge with the Centreon solution and then to implement them to monitor your first equipment.

To go further with templates, please read the templates chapter.
If you have a license for it, you can use our Auto Discovery feature to find and configure hosts easily. See also our tutorial on how to detect AWS EC2 instances.
Installation of basic monitoring templates
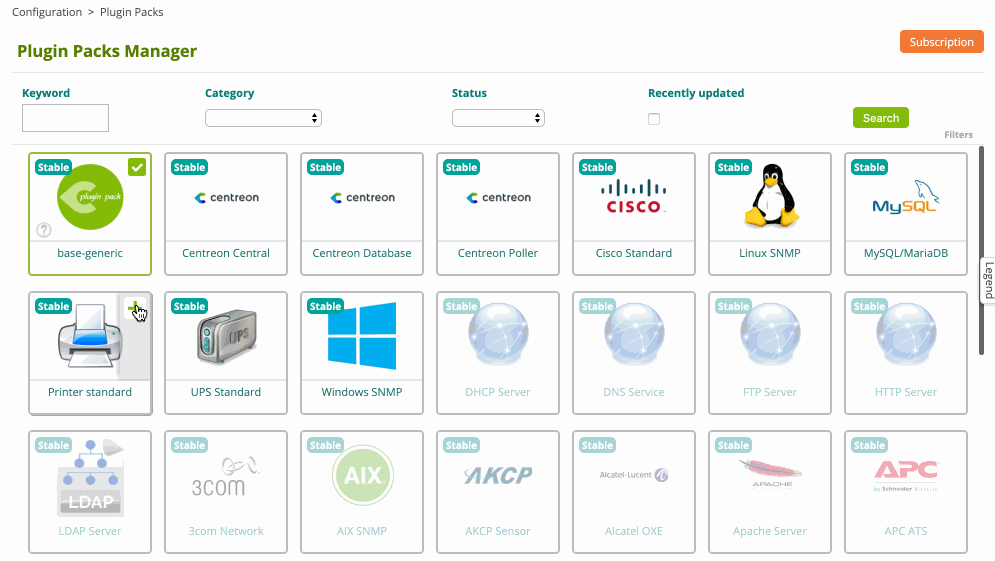
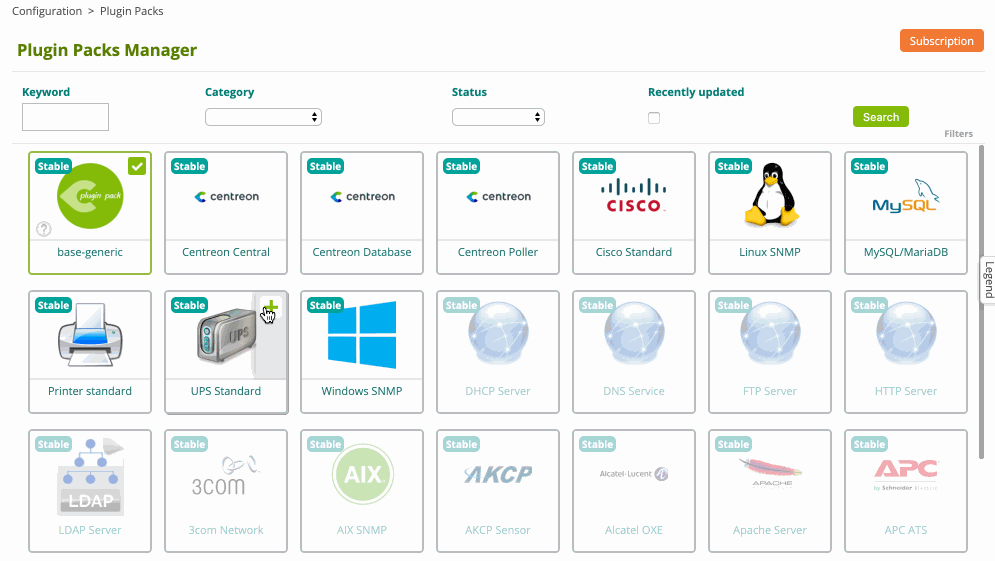
Go to the Configuration > Plugin Packs menu.
Configure the proxy to allow the Centreon server to access the internet.
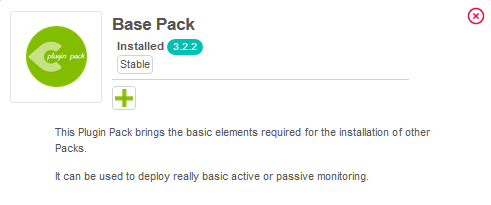
Install the Base Generic Plugin Pack (if it is not already installed) by moving your cursor on it and by clicking on the + icon (it is a prerequisite to the installation of any other Plugin Packs):

You can also click on the Plugin Pack in order to know its content before installing it:
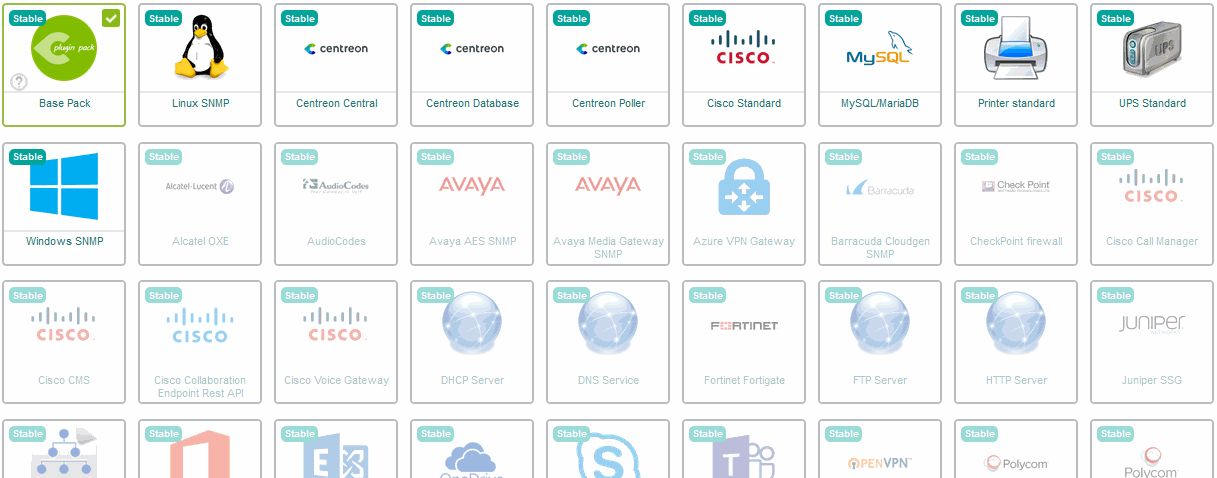
Install other Plugin Packs you probably need for your environment, for example Linux SNMP and Windows SNMP available for free:
Now you have the basic templates and plugins to start monitoring hosts!
Start to monitor your first host
Monitor Printer equipment with SNMP
Go to the Configuration > Plugin Packs menu and install Printer Standard Plugin Pack:
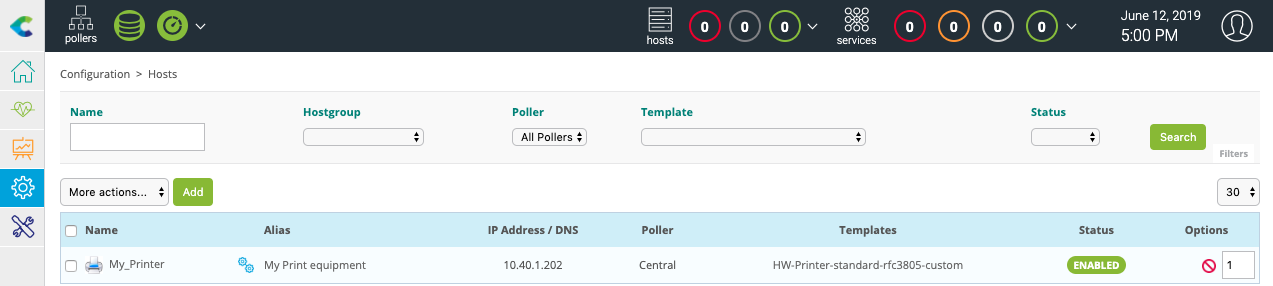
Go to the Configuration > Hosts > Hosts menu and click on Add:
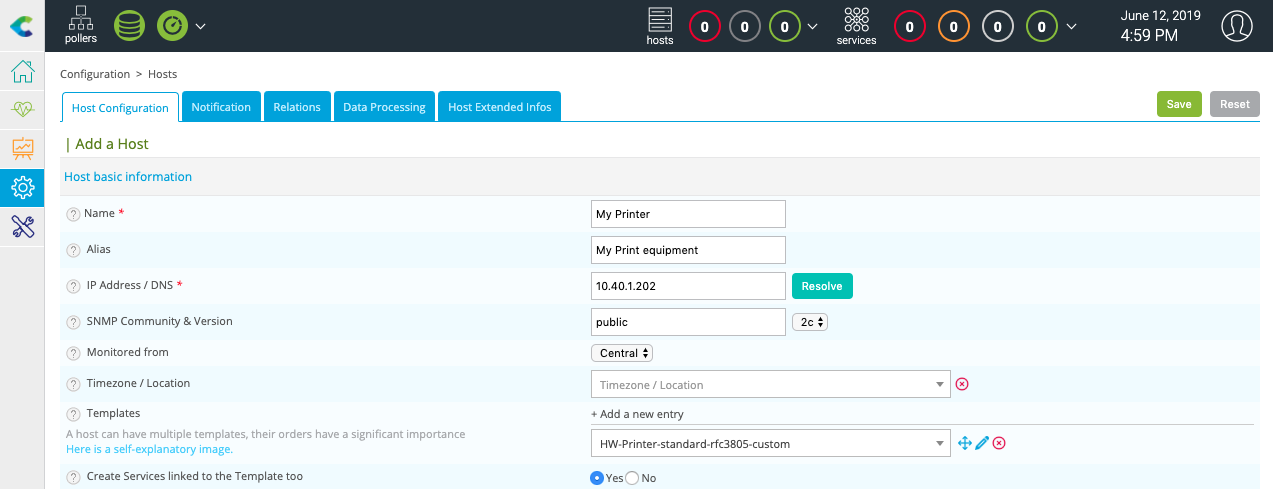
Fill in the following information:
- The name of the server
- A description of the server
- The IP address
- The SNMP version and community
Click on + Add a new entry button in Templates field, then select the HW-Printer-standard-rfc3805-custom template in the list.
Click on Save.
Your equipment has been added to the monitoring configuration:
Go to Configuration > Services > Services by host menu. A set of indicators has been automatically deployed:
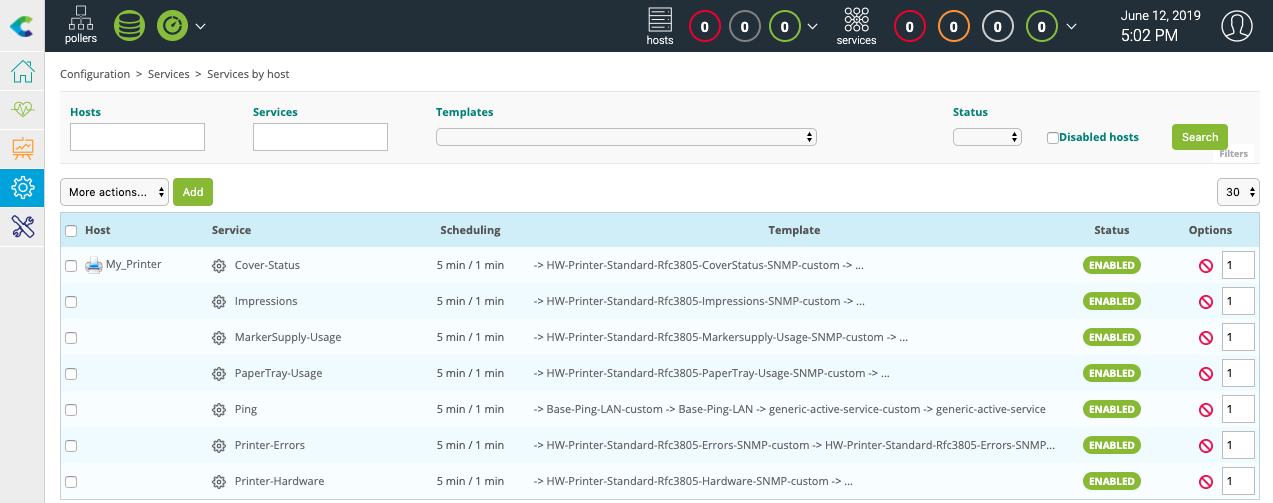
It is now time to deploy the supervision.
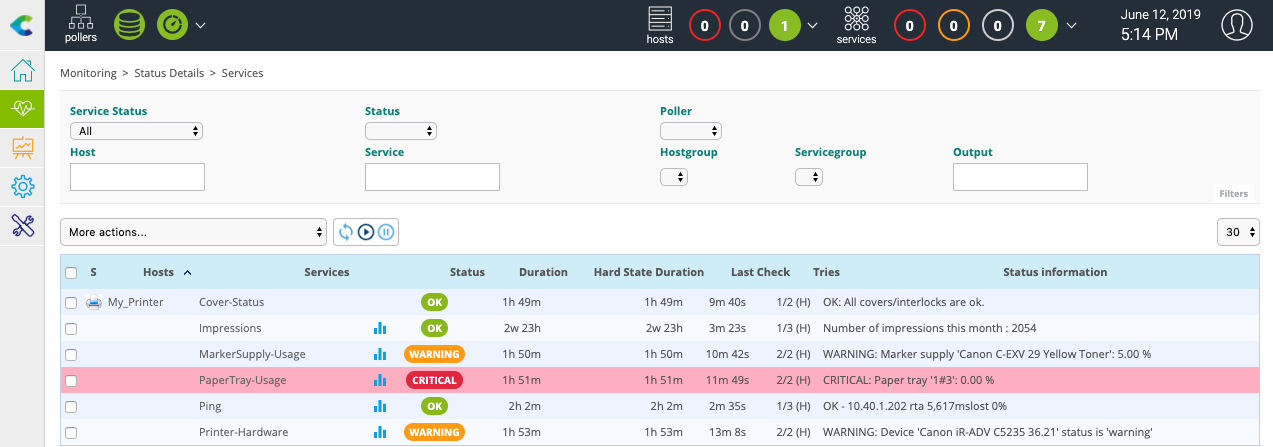
Then go to the Monitoring > Status Details > Services menu and select All value for the Service Status filter. After a few minutes, the first results of the monitoring appear:
Monitor UPS equipment with SNMP
Go to the Configuration > Plugin Packs menu and install UPS Standard Plugin Pack:
Go to the Configuration > Hosts > Hosts menu and click on Add:
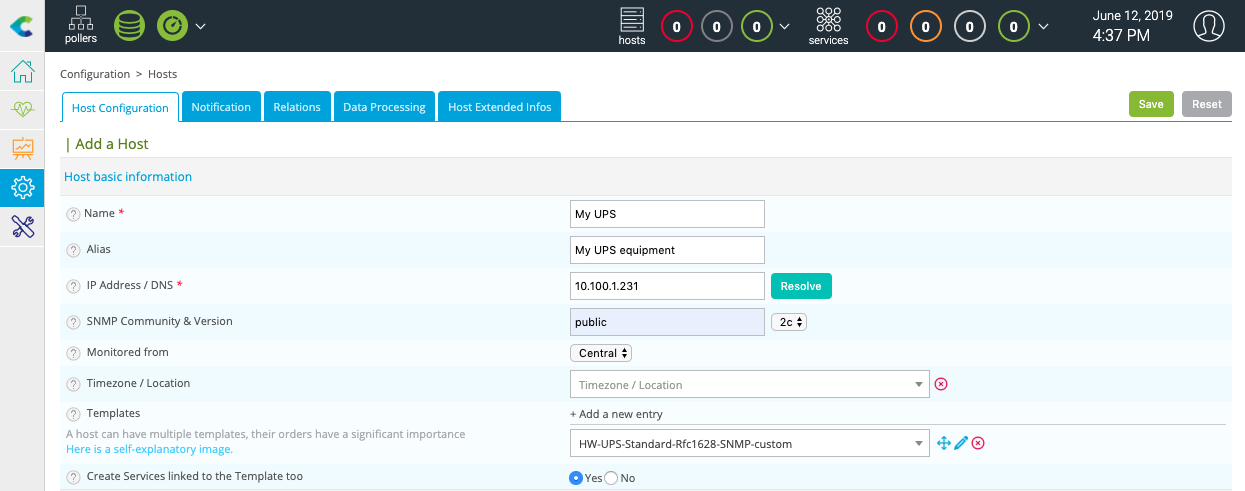
Fill in the following information:
- The name of the server
- A description of the server
- The IP address
- The SNMP version and community
Click on + Add a new entry button in Templates field, then select the HW-UPS-Standard-Rfc1628-SNMP-custom template in the list.
Click on Save.
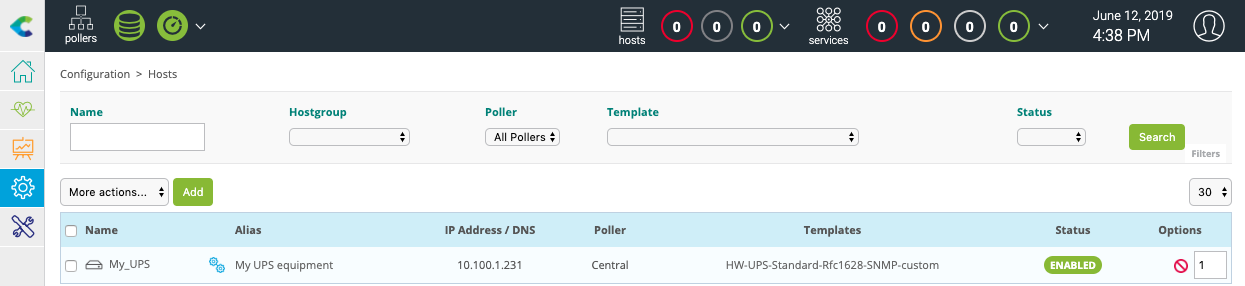
Your equipment has been added to the monitoring configuration:
Go to Configuration > Services > Services by host menu. A set of indicators has been automatically deployed:
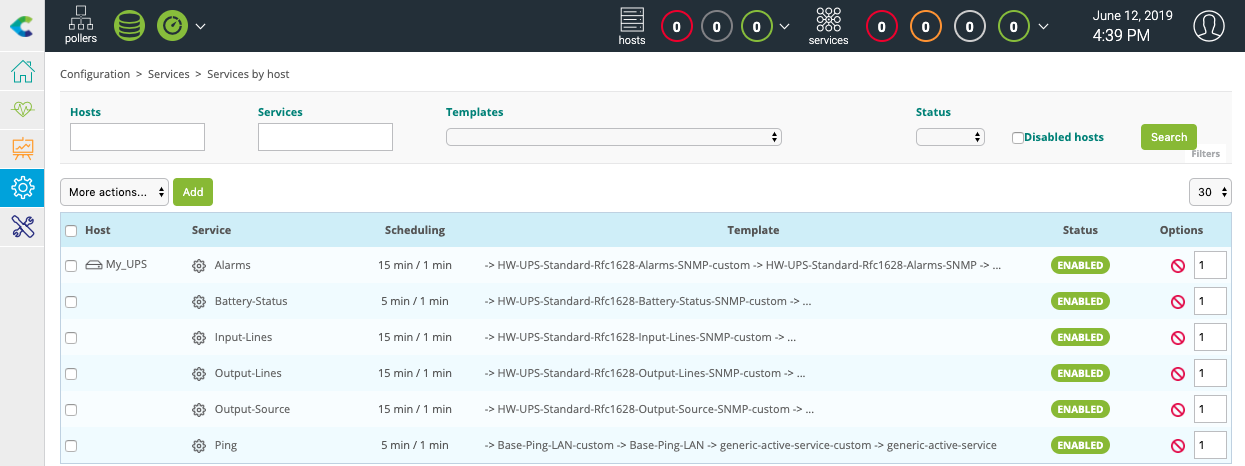
It is now time to deploy the supervision.
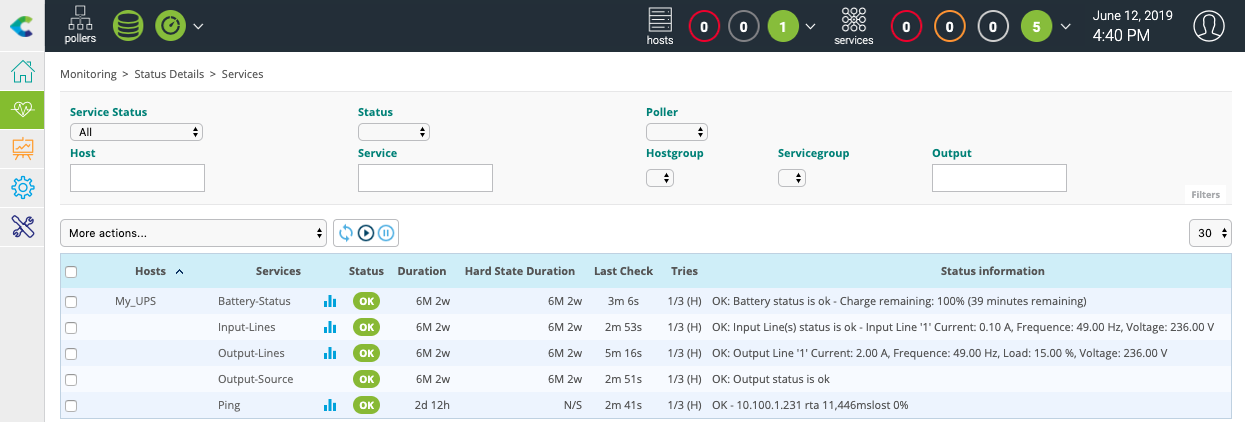
Then go to the Monitoring > Status Details > Services menu and select All value for the Service Status filter. After a few minutes, the first results of the monitoring appear:
Deploying a configuration
On creation/deletion/change of objects via the configuration interface, the changes performed are not applied automatically to the monitoring engine. To apply the changes performed, it is necessary to follow the procedure below.
Go to Configuration > Pollers > Pollers.
Select the pollers whose configuration you want to export.
Click on Export configuration.

Check the following boxes:
- Generate Configuration Files
- Run monitoring engine debug (-v)
- Move Export Files
- Restart Monitoring Engine.
Click Export.
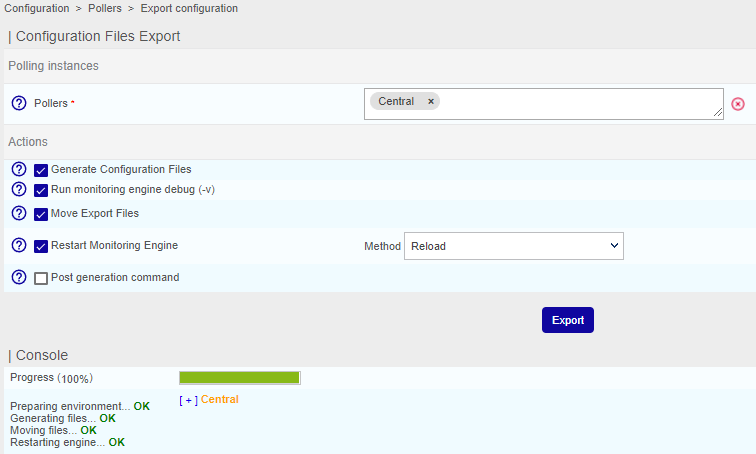
Check that no errors appear during generation.