Centreon plugin for Grafana
The Centreon plugin for Grafana allows you to view in Grafana data from Centreon platforms. If you are already using Grafana to retrieve data from other monitoring platforms, you will be able to view this data side by side with data from Centreon.
Prerequisites
To be able to use the Centreon plugin for Grafana, you must have a valid MBI license, and the module must be installed on your platform.
Available data
A Centreon Data source allows you to view performance data from Centreon in your Grafana dashboards. To select the performance data to display, you can combine filters on various types of resources available on your Centreon platform. You can display metrics, virtual metrics and meta services by building filters on the following types of resources:
- Hosts
- Host groups
- Service Groups
- Services
- Business Activities (if BAM is installed and you have a license for it)
- Anomaly Detection (if the module is installed and you have a license for it)
Performance data are available, but not data such as the status of hosts and services, or acknowledgements and downtimes.
Where do I find the plugin?
The Centreon plugin for Grafana is available on Centreon's download page.
How do I set up the plugin?
You can use the Centreon data source for Grafana as an unsigned plugin in your private Grafana installation. (This is not possible with a Cloud instance.)
To use the Centreon data source as an unsigned plugin:
Make sure you have administration privileges on the machine where Grafana runs.
Download the zip file containing the data source from Centreon's download page. The data source is located in the Grafana subsection of the Custom platform section.
If you do not have a custom init file, create a copy of the grafana/conf/default.ini file and name it custom.ini.
Extract the data source and put it in the plugins directory of your Grafana installation. (The location of this directory is defined in the plugins variable of your grafana/conf/custom.ini file.)
Edit the custom.ini file and add the Centreon data source to the list of allowed unsigned plugins:
allow_loading_unsigned_plugins = centreon2-centreon-datasourceRestart the Grafana service.
- Linux
- Windows
systemctl restart grafana-server
On the Services tab of the tasks manager, right-click the Grafana service and then click Restart.
The Centreon data source now appears in the list of available plugins, on page Configuration > Plugins of the Grafana interface.
Comparing data within a graph
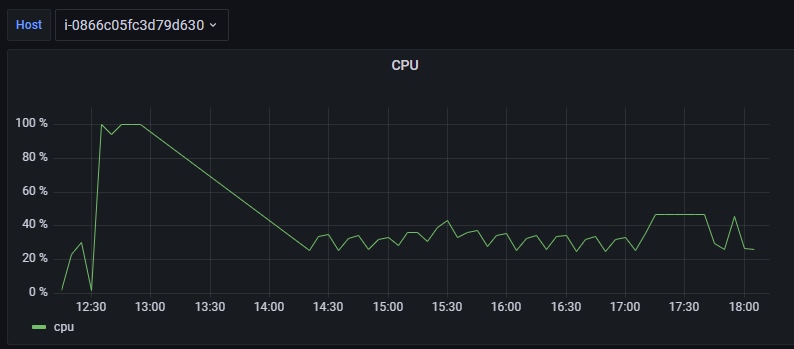
Using the Centreon plugin for Grafana means that all of your performance data is available in Grafana and you can filter it according to specific data groups. For instance, within the same graph, you can compare the evolution of a metric common to several hosts or to the various hosts of a given host group.
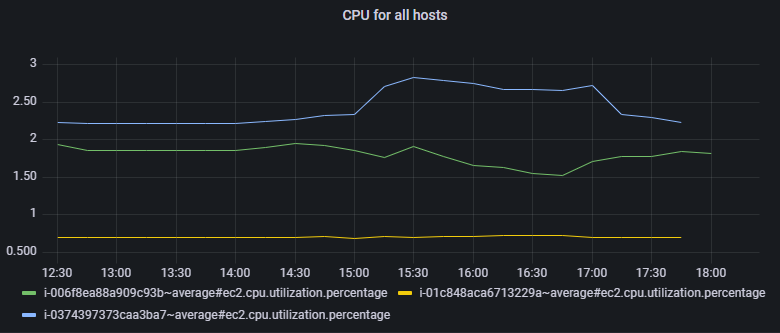
You can use the * wildcard to filter on several hosts at once. Using variables inside filters allow you to create dynamic contexts.
Filtering using variables
A Grafana dashboard can contain a number of panels. Each panel can display data from a specific source. In that way, you can compare data relating to the same host but from different sources, e.g. if you are monitoring different data on the same device using several tools.
Use variables to select a list of resources that match filters (e.g. all hosts in the Linux host group). In the dashboard, filters will automatically display the corresponding variables.