Widget NtopNG
Use the NtopNG widget in custom views to view data about network usage collected by an NtopNG server.
The widget can display the following views (see Examples below):
- Top N Local address : Display the n local hosts that receive/emit the most traffic
- Top N Remote address : Display the n remote hosts that receive/emit the most traffic
- Top N Flows : Display the top n flows by network usage (local/remote hosts and ports)
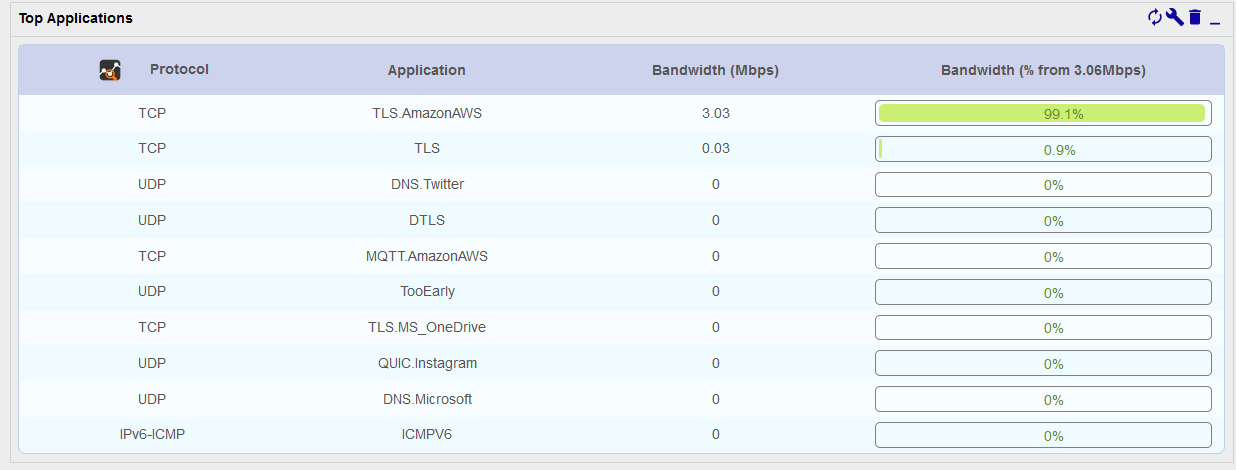
- Top N Applications : Display the n applications that emit/receive the most traffic (group flows by application)
Install the widget
- Install the following package on the central server:
yum install centreon-widget-ntopng-listing
- On page Administration > Extensions > Manager, install the NtopNG widget.
Configure the widget
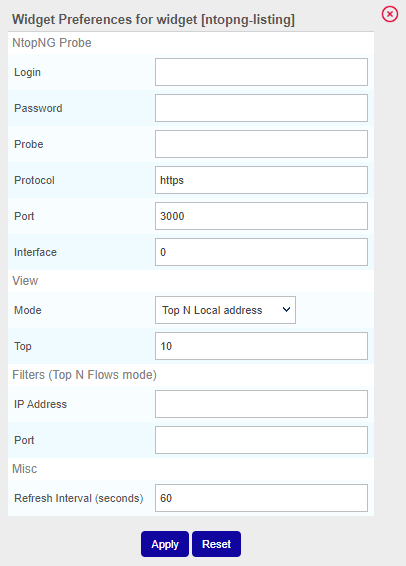
To configure the widget, click on the wrench icon in its top right corner. A window opens:

NtopNG Probe
- Login: Account used to access NtopNG (we recommend not to use an admin account)
- Password: Password for this account
- Probe: IP address of your NtopNG server
- Protocol: Protocol to use to connect to NtopNG (https by default)
- Port: Network port to connect to NtopNG (TCP/3000 by default)
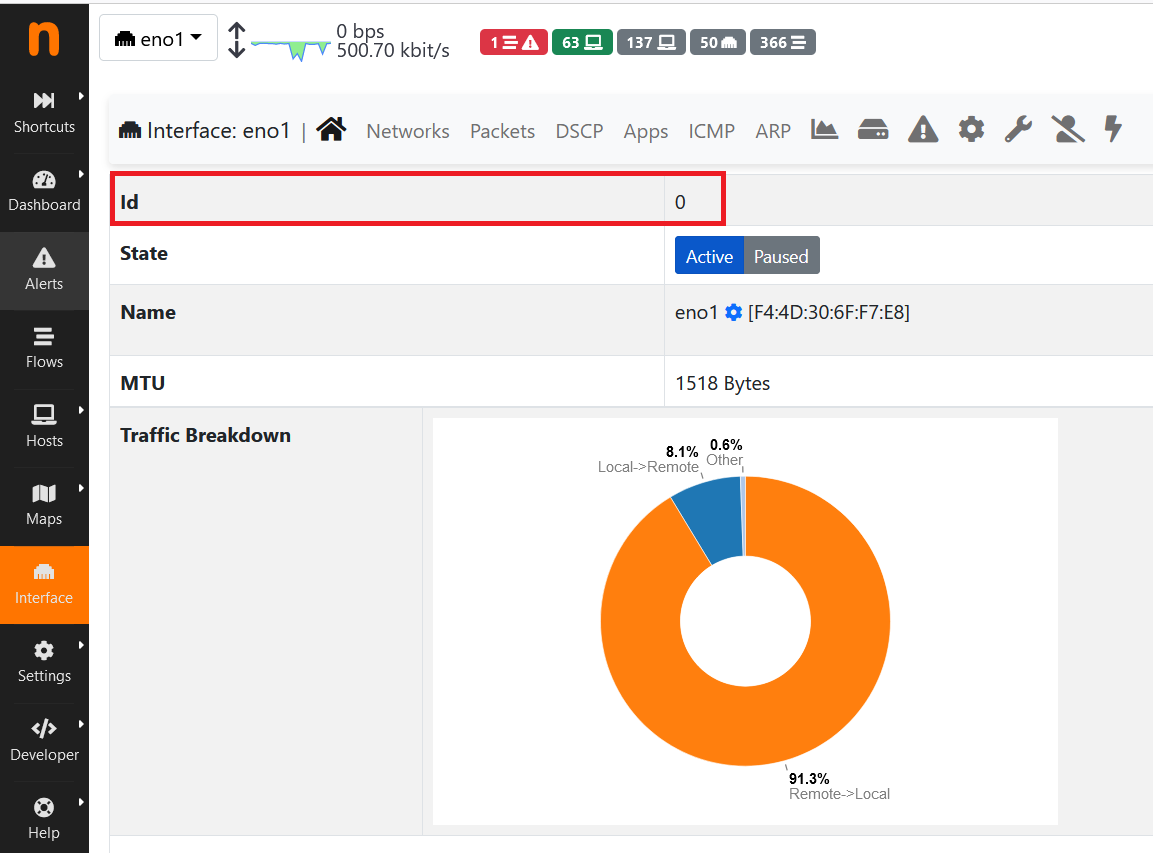
- Interface: ID of the interface. You can find it in the NtopNG interface, on page Interface:

View
- Mode: Select the data you want to display
- Top: Define how many lines should be displayed
Filters
Those filters only work for the Top N Flows view. You can filter on an IP address, on a port, or on both.
- IP Address: Display only the traffic related to a specific IP Address (do not use a hostname)
- Port: Display only the traffic on this particular port.
Misc
- Refresh interval (seconds): Define how often the data should be refreshed.
Examples
Top N Local address

Top N Remote address

Top N Flows
Widget without a filter:

Widget with a filter on an IP address:

Widget with a filter on a port and an IP address:

Top N Applications
