Curves
Definition
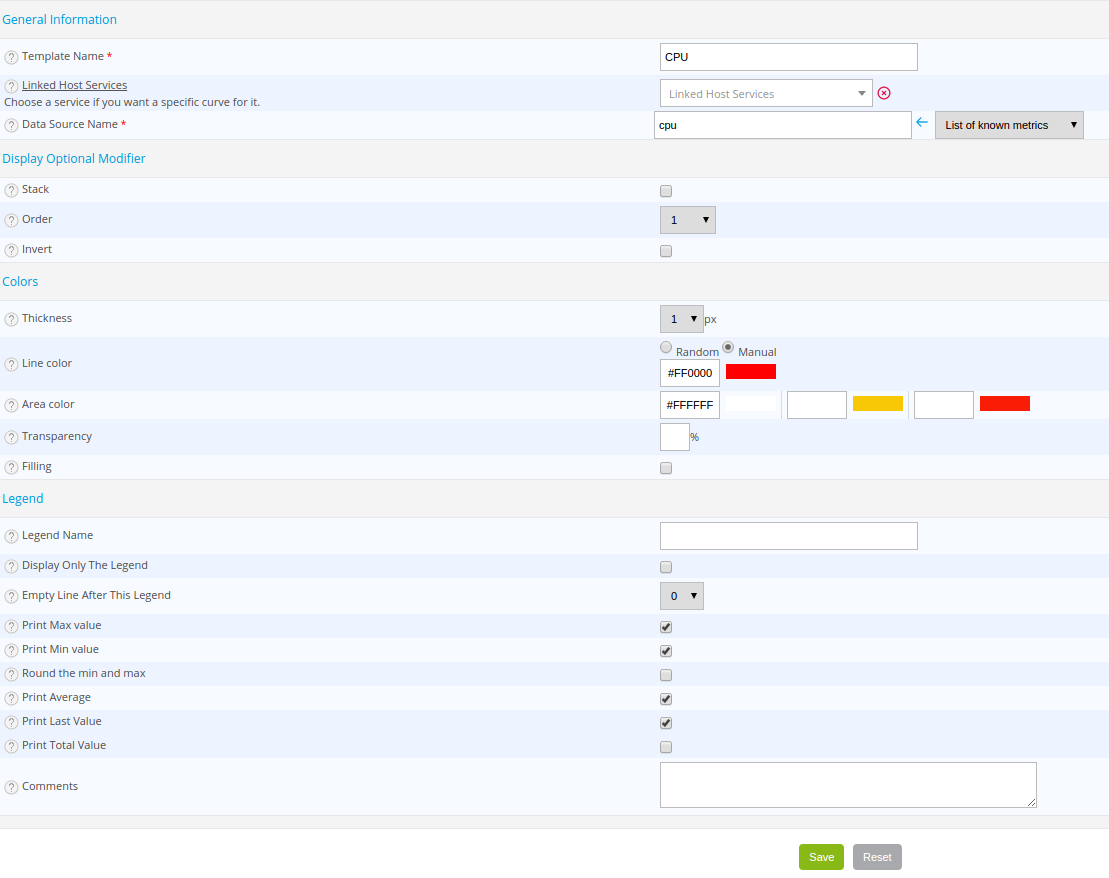
A curve is the representation of the evolution performance data (metrics produced from the collection of data) visible via performance graphs. A graph may contain multiple curves. It is possible to customize the curves by changing certain settings: curve profile, position of the curves on the graph, legend and additional information (average, total value, etc.).
Configuration
Go to the Monitoring > Performances > Curves menu

- The Template Name field defines the name of the model.
- The Hosts/Service Data Source lists defines the host/service for which this curve will be used. If this information is not filled in, this curve definition will be applied to all services in which this metric appears.
- The Data Source Name field can be used to select the metric which will use this definition. The List of known metrics list can be used to choose the already existing metrics used by the services.
- If the Stack box is checked, this curve will be stacked on the others (useful to see the proportion of one metric in relation to another).
- If the Stack box is checked, the Order list can be used to define the order display / stacking of the curve (the smaller the number, the closer it will be to the x-axis).
- If the Invert box is checked, the curve is reversed (opposite to the absolute value) in relation to the y-axis (useful for seeing the proportion of the incoming traffic compared to the outgoing traffic).
- The Thickness list expresses the thickness of the line of the curve (expressed in pixels).
- The Line color field defines the color of the curve.
- The Area color field concerns the filling color of the curve if the Filling option is checked, (see below). It contains 3 fields that correspond with the colors of the OK, WARNING and CRITICAL statuses respectively.
- The Transparency field defines the level of transparency of the contour color.
- If the Filling box is checked, all the curve is filled with the color of the area defined according to the status.
The attributes below concern the information situated under the graph:
- The Legend field defines the legend of the curve.
- If the Display only the legend box is checked, the curve will be masked but the legend will be visible.
- The Empty lines after this legend list can be used to define a certain number of empty lines after the legend.
- If the Print max value box is checked, the maximum value reached by the curve will be displayed.
- If the Print min value box is checked, the minimum value reached by the curve will be displayed.
- If the Round the min and max box is checked, the minimum and maximum values will be rounded.
- If the Print Average box is checked, the average of the points of the curve will be displayed.
- If the Print last value box is checked, the last value collected from the curve will be displayed.
- If the Print total value box is checked, the total value is displayed (sum of all the values of the curve on the selected period).
- The Comment field can be used to comment on the curve.
Examples of curves
Stacked curves:

Reversed curves:

Curves with filling:
