Display views
The existing standard and geographic views are accessible from the Centreon web user interface, if you have been given access privileges. You can display them using the Monitoring > Map menu or using the dedicated Centreon Map widget.
Below, you will find the dedicated features of the Centreon Map web interface that facilitate its use and interactions with views.
Understand tooltips
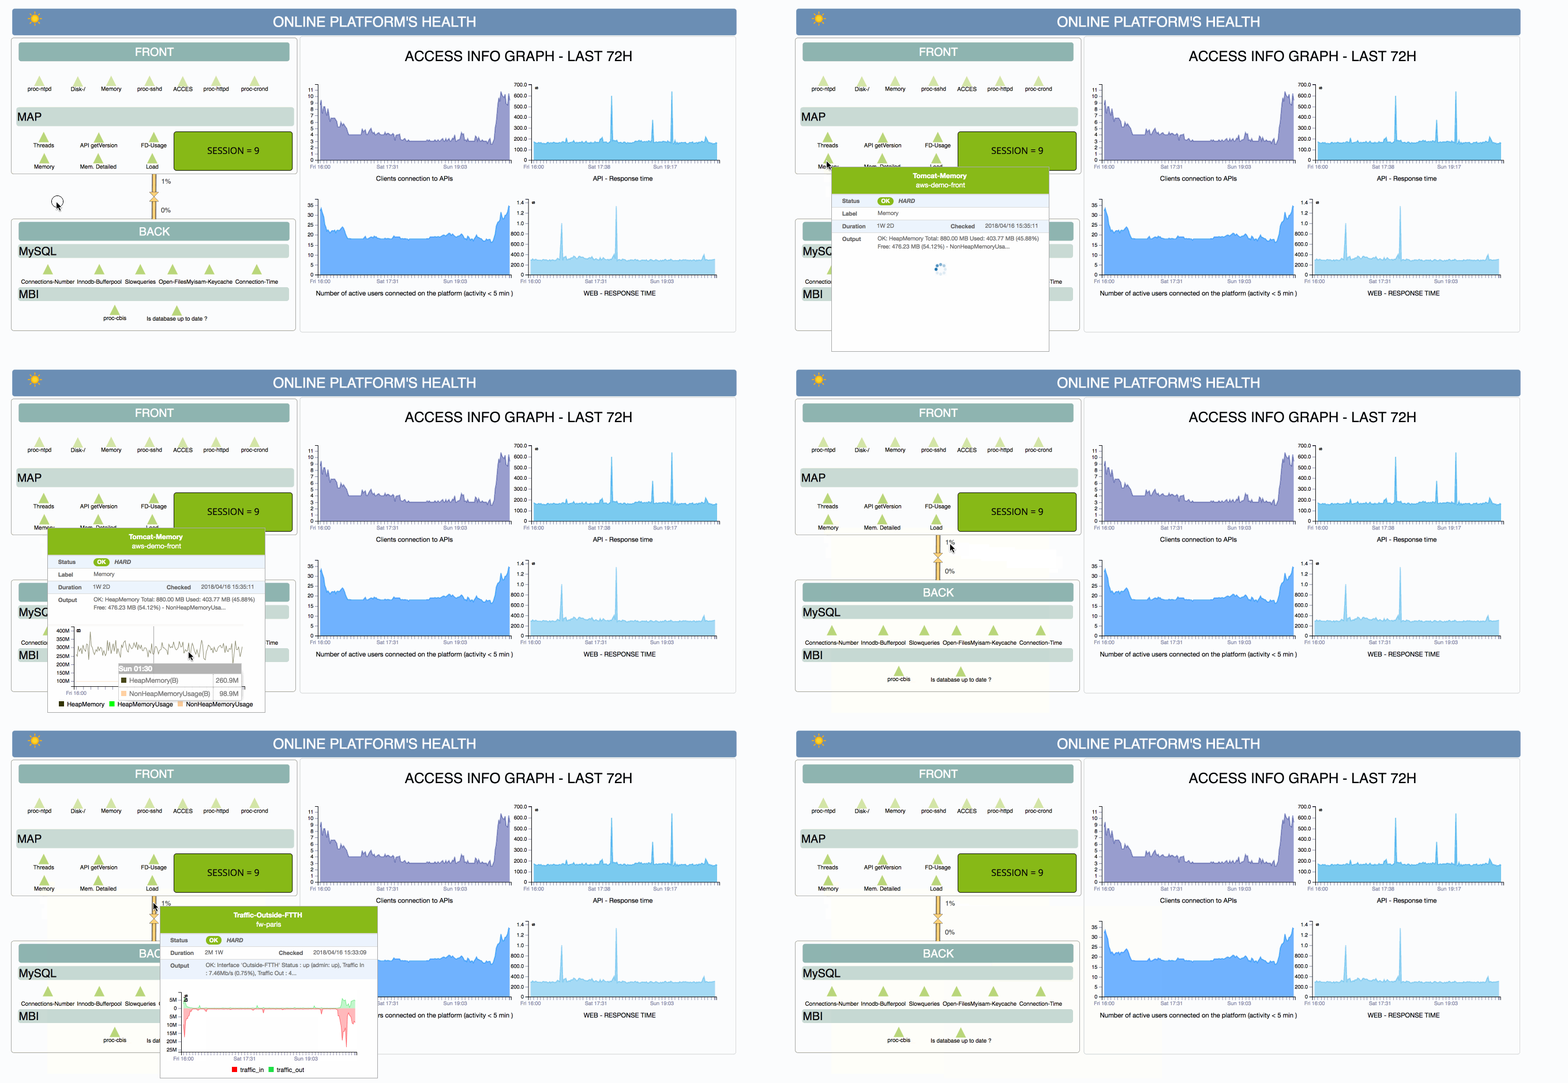
On the web interface, there are information windows called tooltips. They appear when your mouse hovers over some types of objects in a view: links (status & metric), services, metaservices, hosts, host groups and service groups. This window is kept open as long as your cursor is over the tooltip.

Depending on the type of GUI object under your mouse, different information will be displayed. For instance, a link (status & metric, services and metaservice) would display:
- Acknowledgment information (if present)
- Downtime information (if present)
- Duration
- Output.
In the case of hosts, host groups and service objects, this "mouseover" summary information includes a list of the five most recently used resources in the sublevel that currently impact the host/host group or service group.
The following rules apply:
- If a host is down, attached services are never displayed in a tooltip.
- For a host: The services displayed correspond to the inherited status of the host. For example, if a host is "red", then only Critical services will be displayed.
- For a service group: Services displayed correspond to the inherited status of the service group.
- For a host group: Hosts with the same status as the host group are displayed in a tooltip; and services (if their host is up) with the same inherited status as their host groups are displayed.
In the custom views widget, by default, tooltips are not displayed. It is possible to activate them in the widget settings via a checkbox.
Manage link color
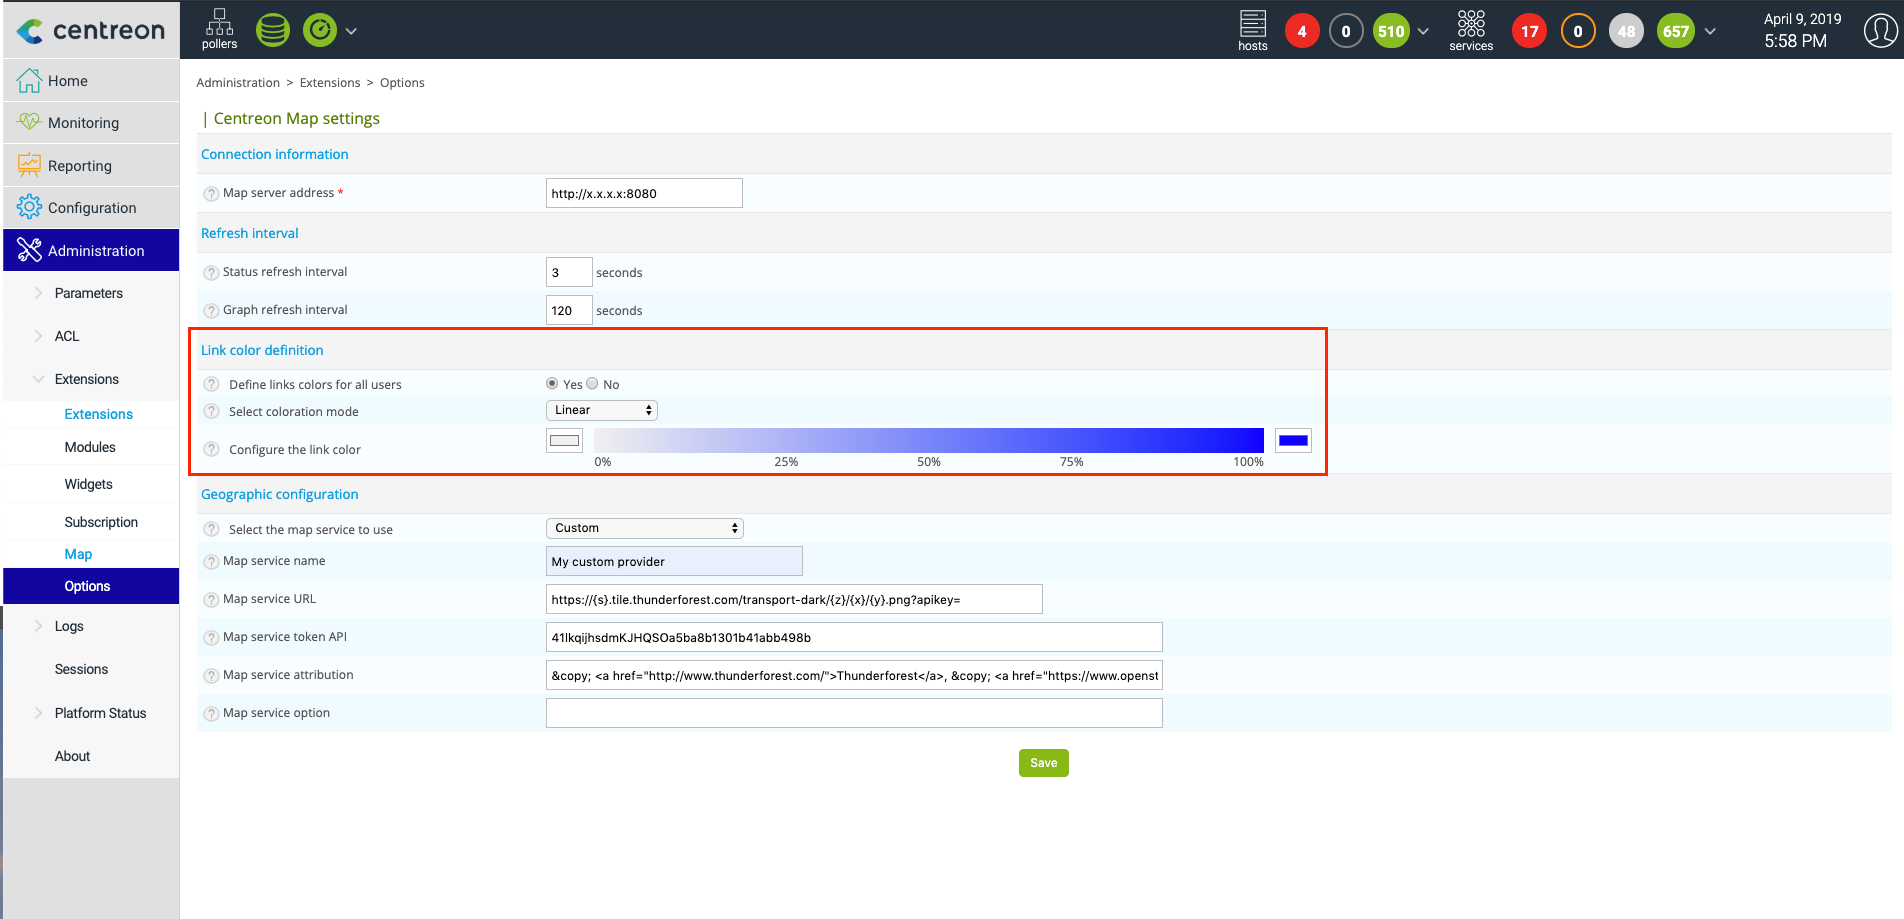
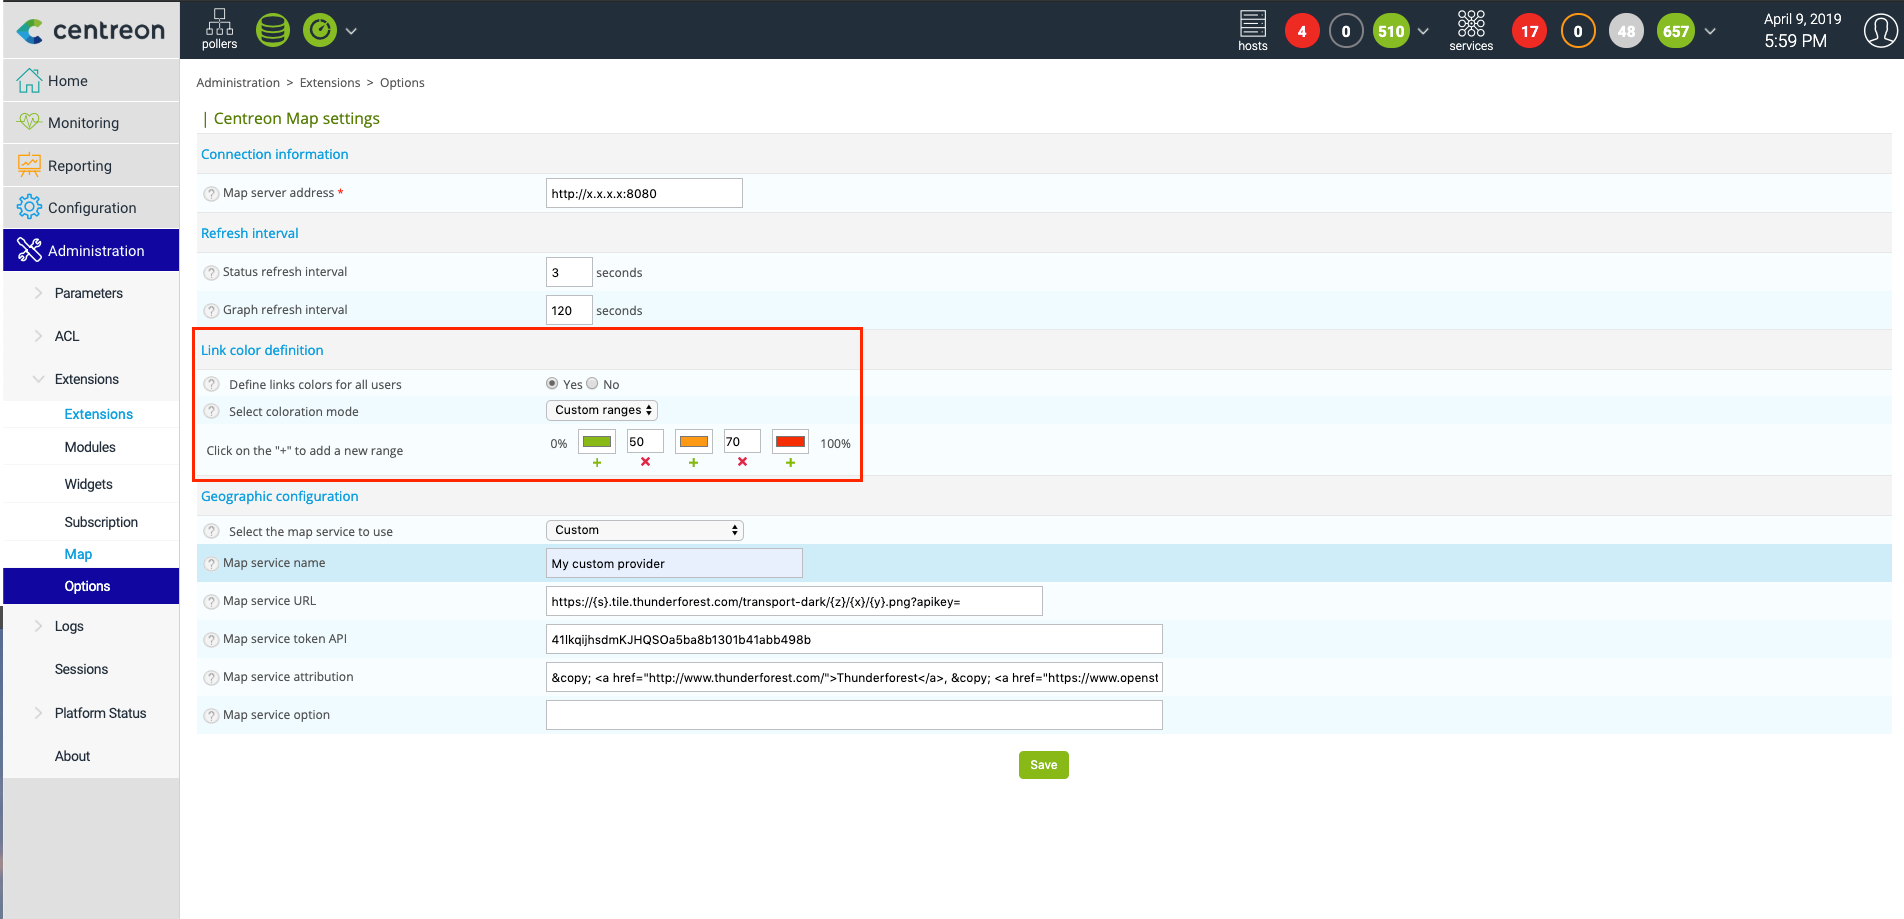
In the previous Centreon Map version, link colors were defined at user level and each user had to configure their own color using the desktop client. We changed this mechanism so that you can define an all user link color scheme globally. To do this:
- Go to Administration > Extension > Map | Options
- In the "Link color definition" section, select the color scheme and parameter you want to apply
Example: linear coloration from gray to blue

Another example: range coloration

Use the widget
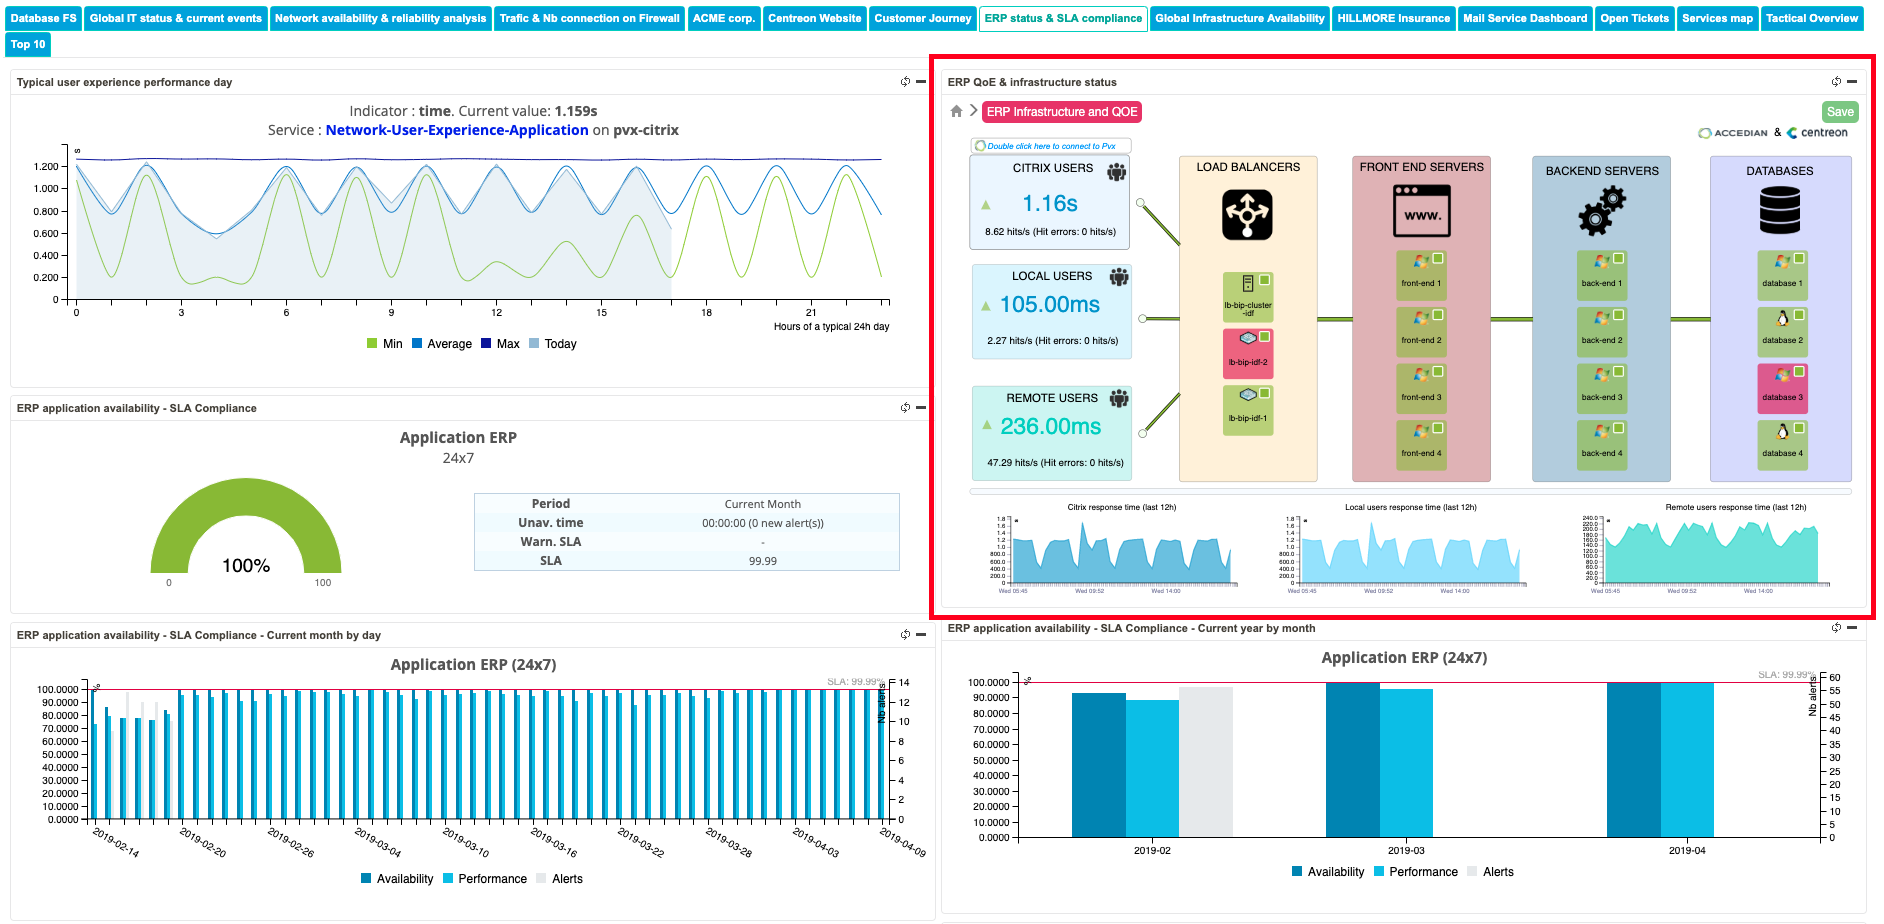
Centreon Map comes with a widget that you can use in Centreon custom views. To do so, add a new widget on the custom view and search for "MAP".
When you add the widget, you can select a view and save position & zoom at any level.
