Possible statuses of a resource
Statuses show the availability of a host, and the availability or performance of a service. Each status has a precise meaning for the resource.
- The statuses and states of a resource can be seen on page Resources Status. You can filter the page according to these statuses and to certain states.
- Some statuses are determined according to user-defined thresholds.
Host status
The table below summarizes all the possible statuses for a host.
| Status | Description |
|---|---|
| UP | The host is available and reachable |
| DOWN | The host is unavailable |
| UNREACHABLE | The host is unreachable: it depends on a host whose status is DOWN |
| PENDING | The host has just been created and has not been checked yet by the monitoring engine |
Service status
The table below summarizes all the possible statuses for a service.
| Status | Description |
|---|---|
| OK | The service presents no problem |
| WARNING | The service has reached the warning threshold |
| CRITICAL | The service has reached the critical threshold |
| UNKNOWN | The status of the service cannot be checked (e.g.: SNMP agent down, etc.) |
| PENDING | The service has just been created and has not been checked yet by the monitoring engine |
States
In addition to their status, resources can be in several states:
-
Acknowledged: indicates that the incident on the service or on the host has been taken into account by a user. Acknowledged resources have a yellow background.
-
In downtime: indicates that notifications are temporarily stopped. Downtime can be planned in advance to avoid receiving alerts during maintenance periods, or can be set following an incident. Resources in downtime have a purple background.
-
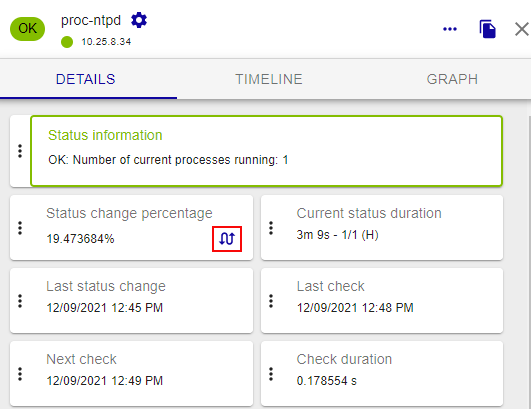
Flapping: indicates that the status change percentage of the resource is very high. This percentage is obtained from calculations performed by the network monitoring engine. Flapping resources have the following icon in their Details panel:

Status types
The status of a resource can be one of these two types:
- SOFT: Means that an incident has just been detected and that it has to be confirmed.
- HARD: Means that the status of the incident is confirmed. Once the status is confirmed, the notification process is engaged (sending of an email, SMS, etc.).
The Tries column in the Resource Status page indicates the number of attempts made to confirm a status. It also shows a letter (H or S) corresponding the type of status.
You can filter the view on the Resources Status page according to the status type.
Explanation
An incident (Not-OK status) is confirmed as soon as the number of validation attempts has reached its end. The configuration of a resource (host or service) requires a regular check interval, a number of attempts to confirm a Not-OK status and an irregular check interval. As soon as the first incident is detected, the state is "SOFT" until its confirmation into "HARD", triggering the notification process.
Example:
A service has the following check settings:
- Max check attempts: 3
- Normal check interval: 5 minutes
- Retry check interval: 1 minute
Let us imagine the following scenario:

| Time | Check attempt | Status | Status type | State change | Note |
|---|---|---|---|---|---|
| t+0 | 1/3 | OK | HARD | No | Initial state of the service |
| t+5 | 1/3 | CRITICAL | SOFT | Yes | First detection of a non-OK state. Event handlers execute. |
| t+6 | 2/3 | WARNING | SOFT | Yes | Service continues to be in a non-OK state. Event handlers execute. |
| t+7 | 3/3 | CRITICAL | HARD | Yes | Max check attempts has been reached, so service goes into a HARD state. Event handlers execute and a problem notification is sent out. Check # is reset to 1 immediately after this happens. |
| t+12 | 3/3 | WARNING | HARD | Yes | Service changes to a HARD WARNING state. Event handlers execute and a problem notification is sent out. |
| t+17 | 3/3 | WARNING | HARD | No | Service stabilizes in a HARD problem state. Depending on what the notification interval for the service is, another notification might be sent out. |
| t+22 | 1/3 | OK | HARD | Yes | Service experiences a HARD recovery. Event handlers execute and a recovery notification is sent out. |
| t+27 | 1/3 | OK | HARD | No | Service is still OK. |
| t+32 | 1/3 | UNKNOWN | SOFT | Yes | Service is detected as changing to a SOFT non-OK state. Event handlers execute. |
| t+33 | 2/3 | OK | SOFT | Yes | Service experiences a SOFT recovery. Event handlers are executed, but no notification is sent, as this wasn't a "real" problem. State type is set to HARD and check # is reset to 1 immediately after this happens. |
| t+34 | 1/3 | OK | HARD | No | Service stabilizes in an OK state. |