Introduction to Centreon MBI
Complete reporting with Centreon MBI
The reporting capabilities in Centreon rely on the Centreon Monitoring Business Intelligence (MBI) extension.
Centreon MBI is a Centreon extension that requires a valid license. To purchase one and retrieve the necessary repositories, contact Centreon.
Centreon Monitoring Business Intelligence (MBI) is a software tool designed to help business users make critical decisions and to facilitate management of an IT environment. Centreon MBI analyzes data from monitored events, performance counters and capacity accessed from Centreon, providing you with full visibility of your infrastructures and application activities through ITIL compliant reporting.
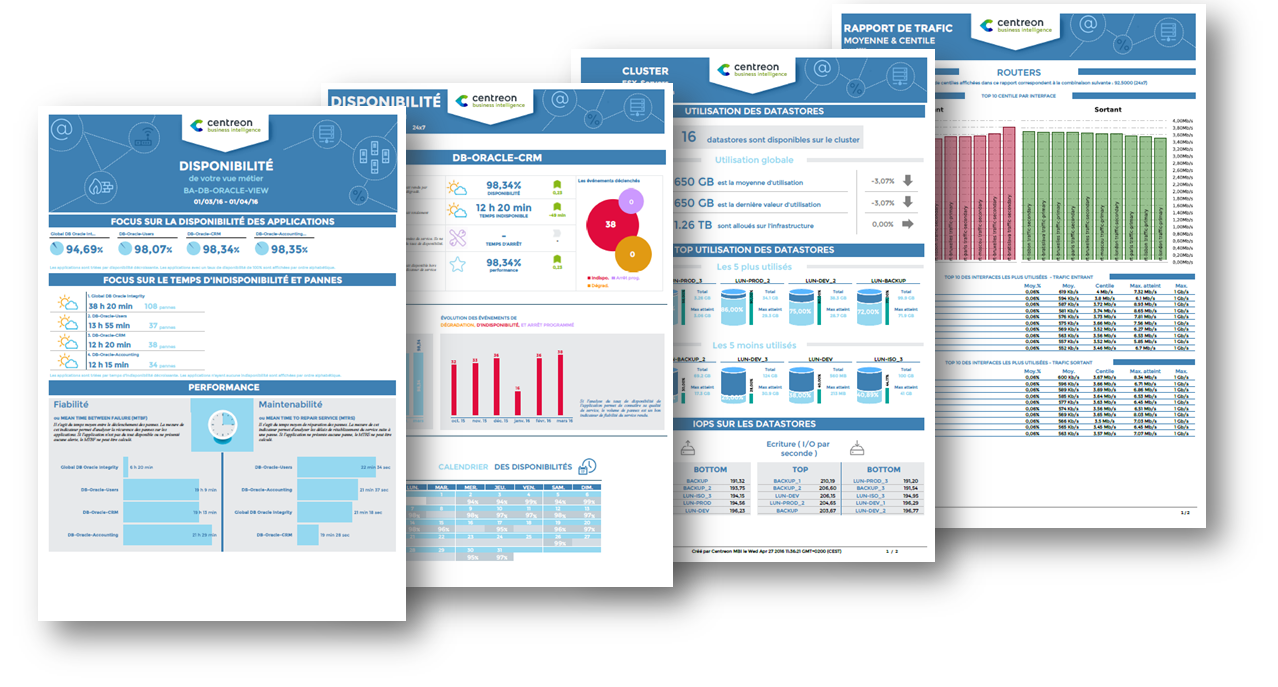
Generate insightful statistics using our 30+ reports designs...

Centreon MBI provides a full package of standard reports that address:
- Capacity planning and management
- Availability management
- SLA (Service Level Agreement) management
- Performance management.
Here are some examples of reports available in Centreon MBI: Reports examples
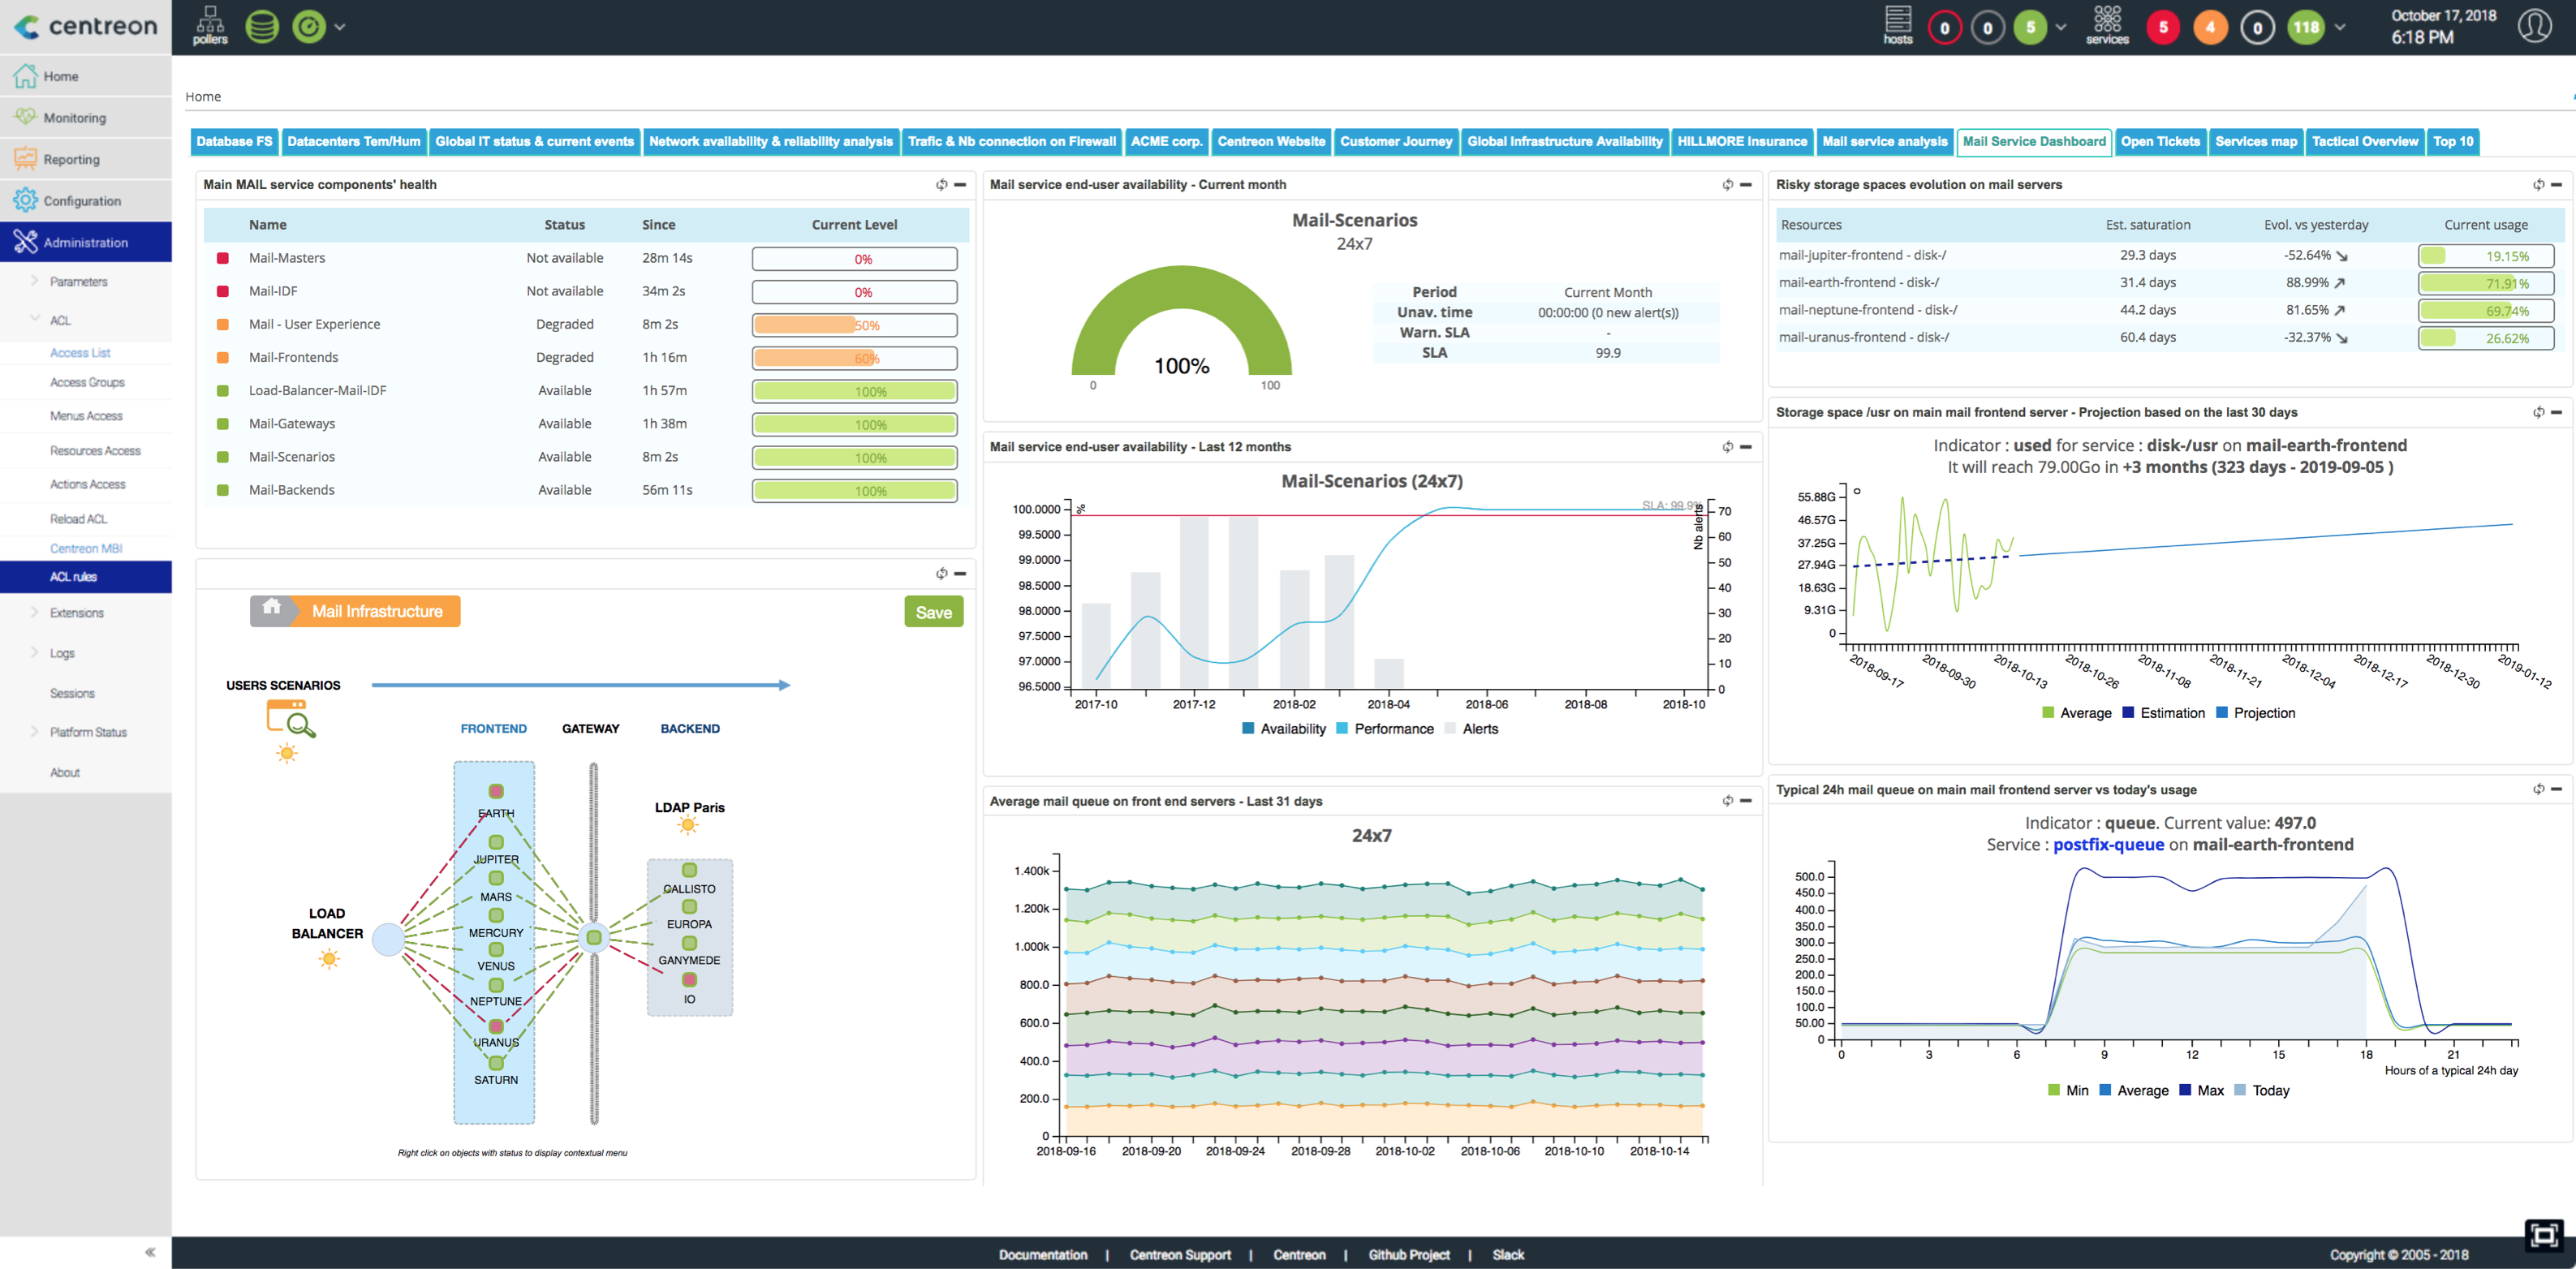
or simply create your own reporting dashboard using our widgets.

Main features:
- Scheduling and generation of standalone reports in PDF, Excel, Word and Powerpoint formats
- Visualization of web & interactive statistics using reporting widgets that are Centreon-compatible
- Publication of reports by e-mail and other standard protocols (FTP, CIFS, etc.)
- Access control to reports
- Administration and user interface integrated into Centreon
- Report development libraries