Custom views (legacy)
Custom views are dashboards created with widgets. You can share views with other users. See also our tutorial on custom views.
Creating a custom view
-
Go to Home > Custom Views.
-
Click the Show/Hide edit mode icon in the top right corner of the page:

The control bar appears:

-
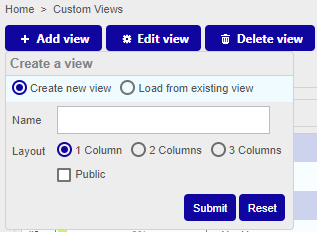
Click Add view: a pop-up window is displayed.
-
Select Create new view:
- enter a name
- select the number of columns you want (i.e. the number of widgets displayed horizontally)
- Select Public to share your view in read-only mode with other users.
-
Click Submit. The view is displayed (it is empty).
-
Click Add widget:
- enter a title (it will be displayed above the widget)
- select the type of widget you want.
-
Click Submit. The widget appears. Some widgets require extra configuration (e.g., selecting a poller): click the wrench icon in the top right corner of the widget to edit it.
-
Once you have created the view and added all the widgets you want, click the Show/Hide edit mode icon again:

Editing a custom view
On the control bar, click Edit view. 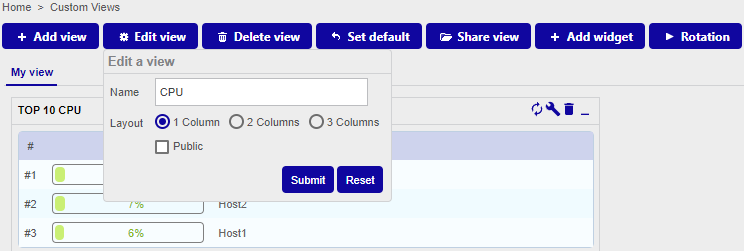
You can rename the view, change the layout of the columns, and share the view in read-only mode with other users. You can also edit or move widgets.
Editing a widget
To edit a widget, click the wrench icon in the top right corner of the widget: ![]()
Rearranging widgets
To move a widget, click the title bar of the widget and drag it to the desired location.
Sharing custom views
You can share a custom view in different ways:
-
In read-only mode:
- Select Public when you create the view or when you edit it.
- Share the view with "locked users" or "locked user groups". All subsequent changes will be inherited by the shared views.
-
Make the view editable:
- Share the view with "unlocked users" or "unlocked user groups". Unlocked users will become the "owner" of their copy of the view and no changes they make will be applied to the original view. In the same manner, no change made by the user who created the view will affect the copies.
To share a view with "locked"/"unlocked users" :
- On the control bar, click Share view.
- Select the options you want (see above).
- Click Share.
Although the fields are called "locked users"/"unlocked users", strictly speaking the view will be locked or unlocked, not the users.
Displaying a custom view users have shared with you
-
On the Home > Custom Views page, click the Show/Hide edit mode icon in the top right corner of the page:

The control bar appears:
-
Click Add view, then select Load from existing view. A dropdown list shows all the views that other users have shared with you.
-
Select a view, then click Submit. The view is displayed.
Configuring the rotation of views
Once you have created several custom views, you can make all views be displayed in turn.
- On the control bar, click Rotation.
- Use the slider to define the number of seconds that each view must be displayed for, then click Apply.
Defining a default view
You can choose which view to display when you access the Home > Custom Views page.
- Click on the view you want.
- On the control bar, click Set default.
List of widgets
| Widget | Description |
|---|---|
| Engine status | Display the statistics for a poller. (Select a poller in the settings.) |
| Global health | Displays a pie chart showing the status of hosts. |
| Graph monitoring | Displays the RRD graph for a service. You must select a service that uses performance data. You can define the timeperiod and the refresh time for the graph in the settings. |
| Grid-map | Display services as colored squares. To configure this widget, select a hostgroup and fill in the "Name services" field, using commas between services (do not use special characters, e.g. slashes, in this widget). |
| Host monitoring | Displays the list of hosts as well as their status and related information. You can filter the list using the criteria you want. |
| Hostgroup monitoring | Displays host groups. It can show a detailed view of services. |
| HTTP loader | Displays a web page. |
| Live top 10 CPU usage | Displays the top 10 hosts by CPU usage. Check that the value of the parameter Metric Name matches the name of the metric used by the CPU service. |
| Live top 10 memory usage | Displays the top 10 hosts by memory usage. |
| Service monitoring | Displays a list of services. Lots of options are available (sort by severity, filters, columns, etc..) |
| Servicegroup monitoring | Displays a list of service groups. |
| Single metric | Displays the value of a single metric for the selected service. |
| Tactical overview | Displays the details for the hosts or services. By default hosts are displayed. |