Create a graphical view
The objective of this tutorial is to help you understand how you can provide real time IT infrastructure status overviews with the data presentation extension called Centreon MAP to your ITOM teams and operational users.
With Centreon MAP, you can simply create and share synthetic real time monitoring views to monitor the performance of your IT infrastructure, network, applications and services.
For instance, this real-time view allows ITOM teams and managers to see the availability of critical business applications and services instantaneously. This guarantees a better reaction time in case of outage and optimizes MTRS (Mean Time to Restore Service).
This tutorial shows you how to create views using Centreon MAP. After reading this article, you will be familiar with Centreon MAP's main features and you will be able to create views that meet your technical or business users' needs.
Centreon MAP is a Centreon extension that requires a valid license key. To purchase one and retrieve the necessary repositories, contact Centreon.
Create a logical view
Before creating a view: define the objective
Define what is the main objective of the view. What need does it meet? Who are the recipients? What are the main topics to consider before creating a view? Here are some questions you might consider:
- Who is/are the recipient(s) (users' profiles) of this view?
- What level of information do users need?
- Do I monitor all the resources and indicators I need to create that view?
- What kind of information should the view contain (resources, indicators, graphs, network links, etc)? It can be interesting to start drawing that view on a paper note.
Now that you have defined the objectives, let's start showing you how to make the view.
The view designer's workspace
Connect to your Centreon MAP server using the desktop client. The following workspace environment should appear empty. To illustrate the explanation, we've opened a view. By default, no view is opened.
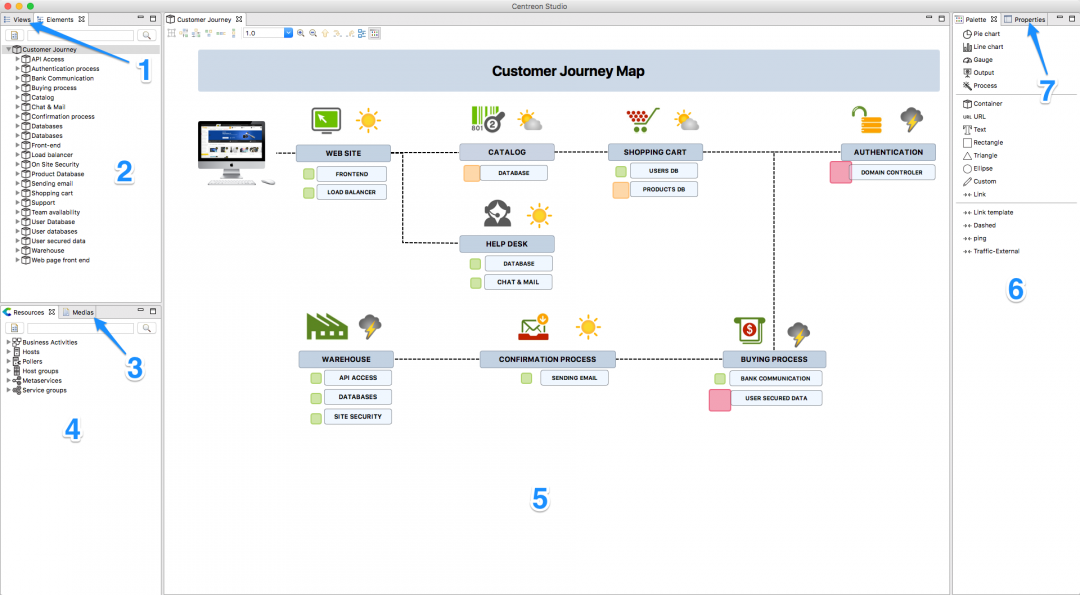
The information and area are organized as follows:
- Views: existing views that are accessible to you.
- Element: objects available in opened views.
- Media: available media (images).
- Resources: Centreon's object that you can use in the view (drag & drop).
- Content of the view.
- Palette: graphical elements that you can use in a view.
- Properties: the selected element's properties.
Create a new view
Right click in the View panel and click Add.
Put resources, widgets and other elements in position using drag and drop and shortcuts.
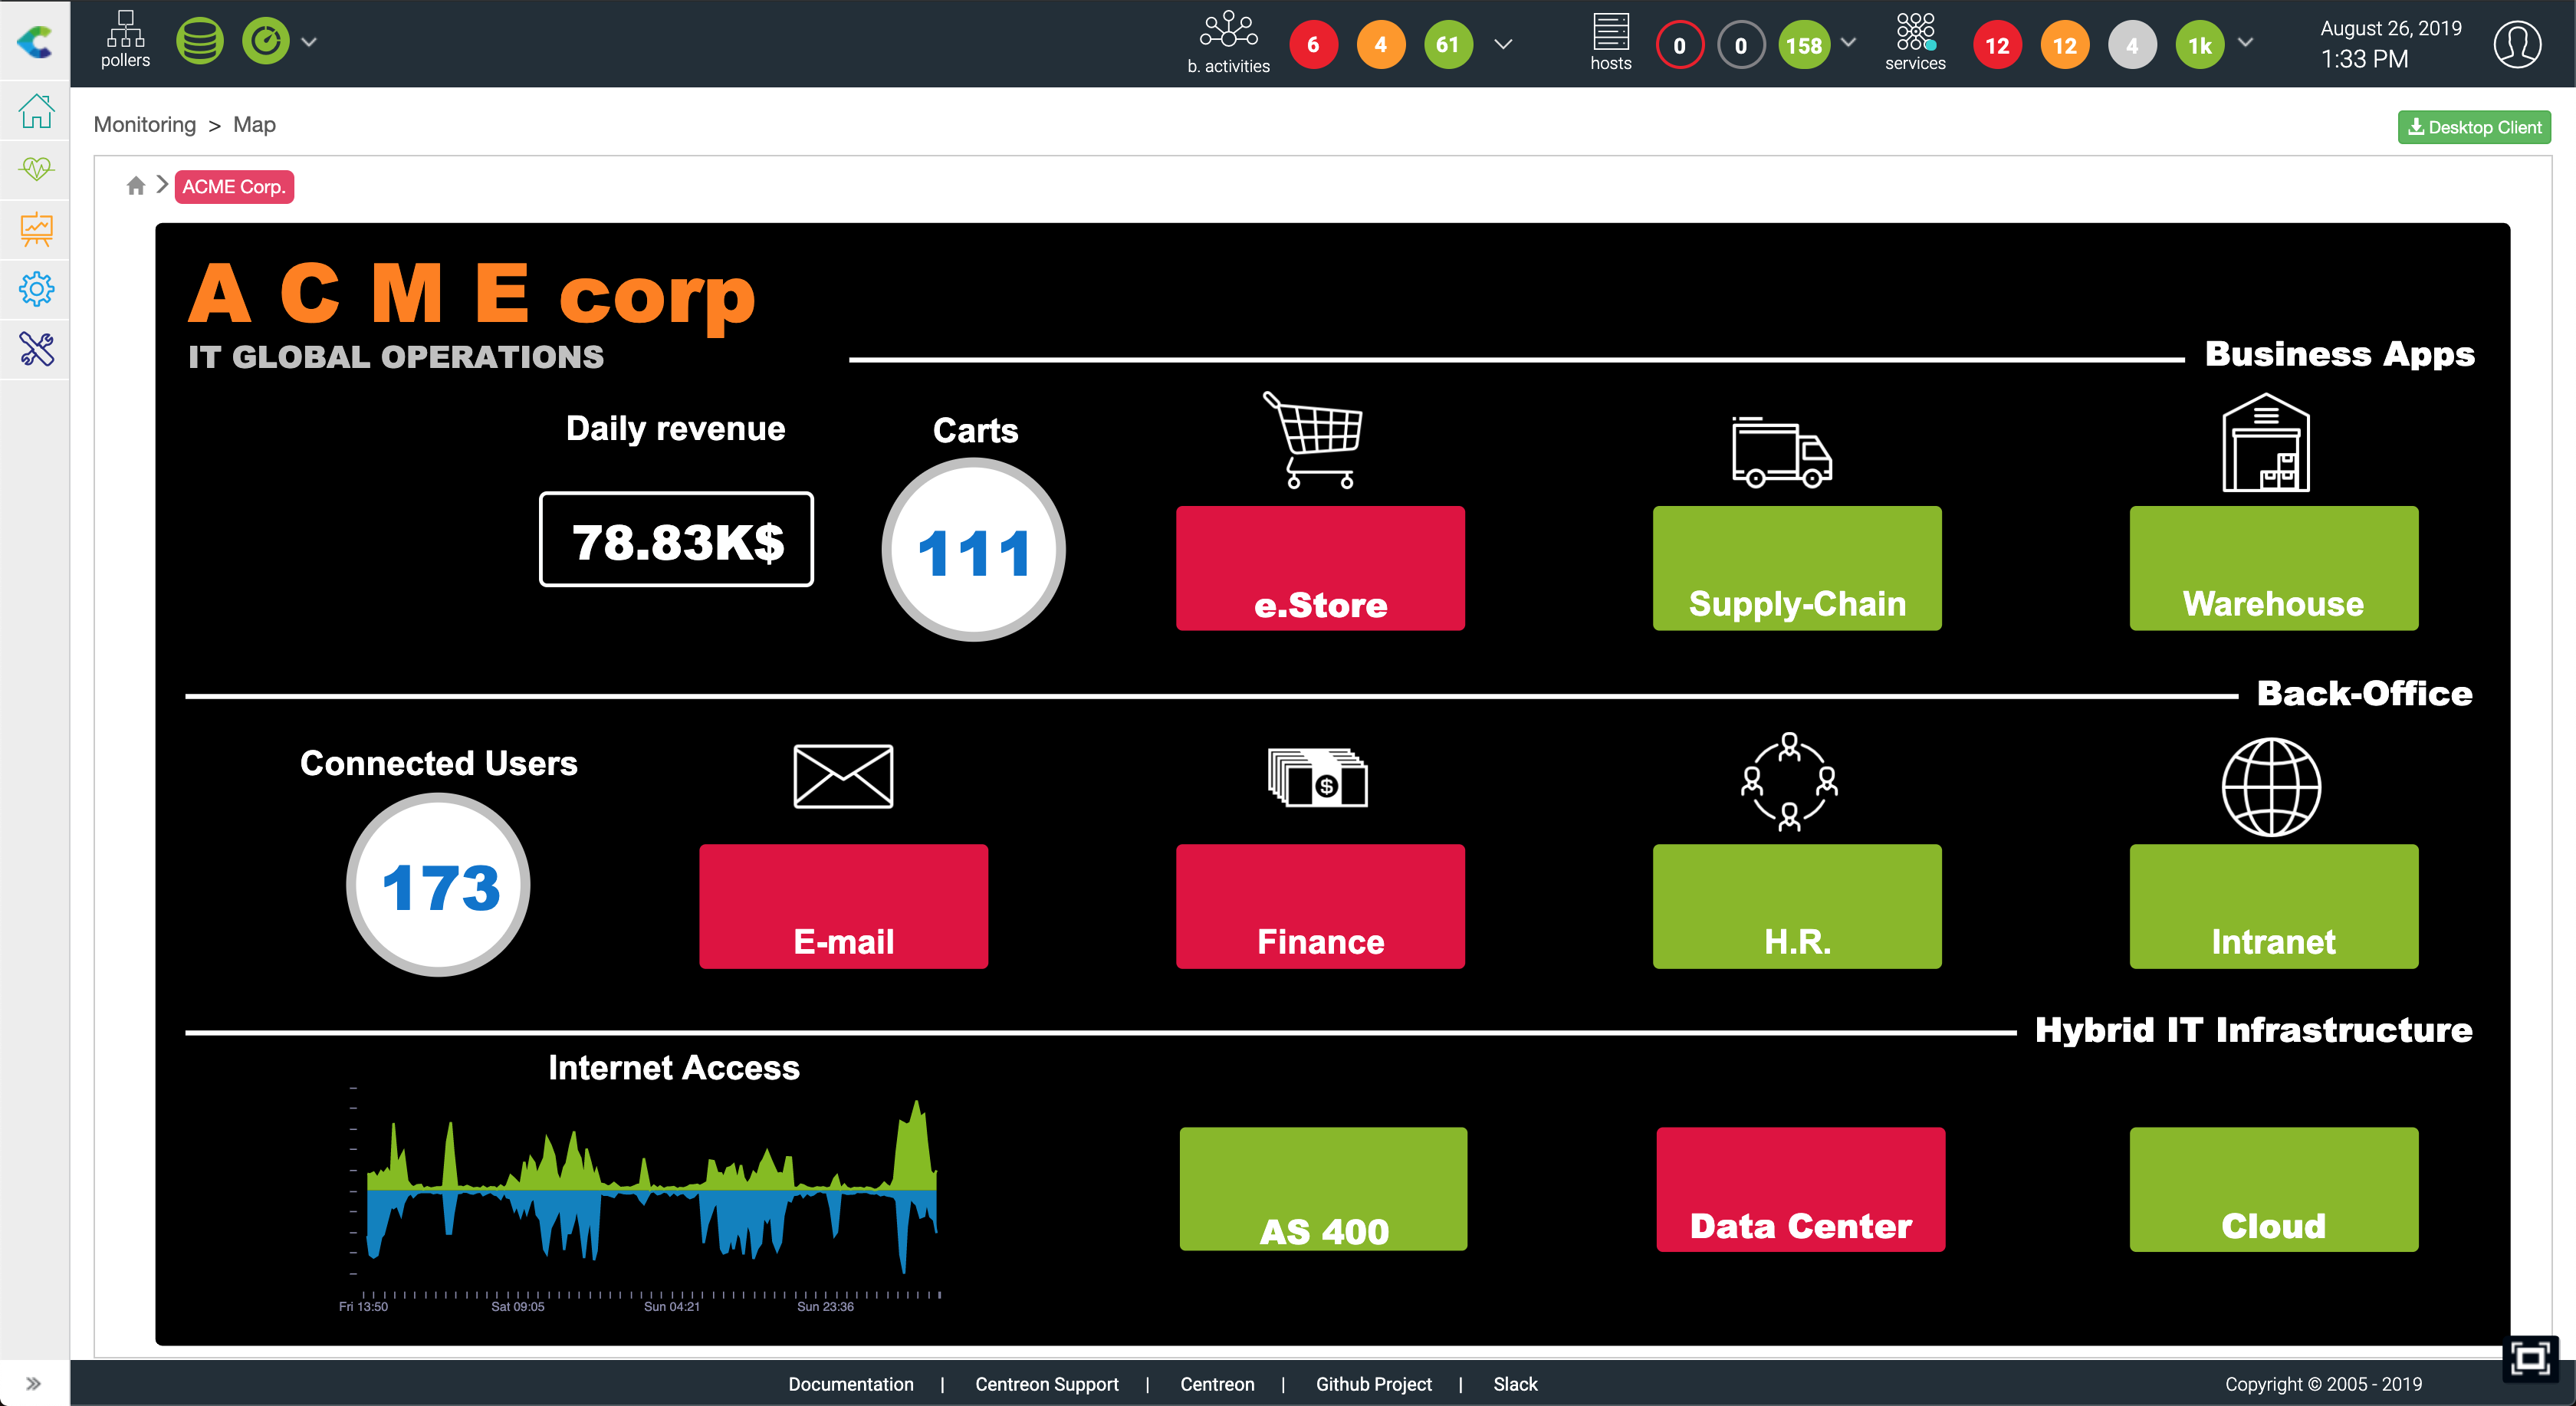
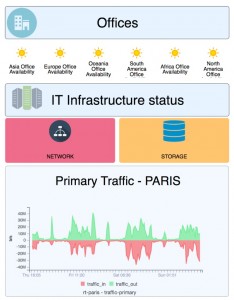
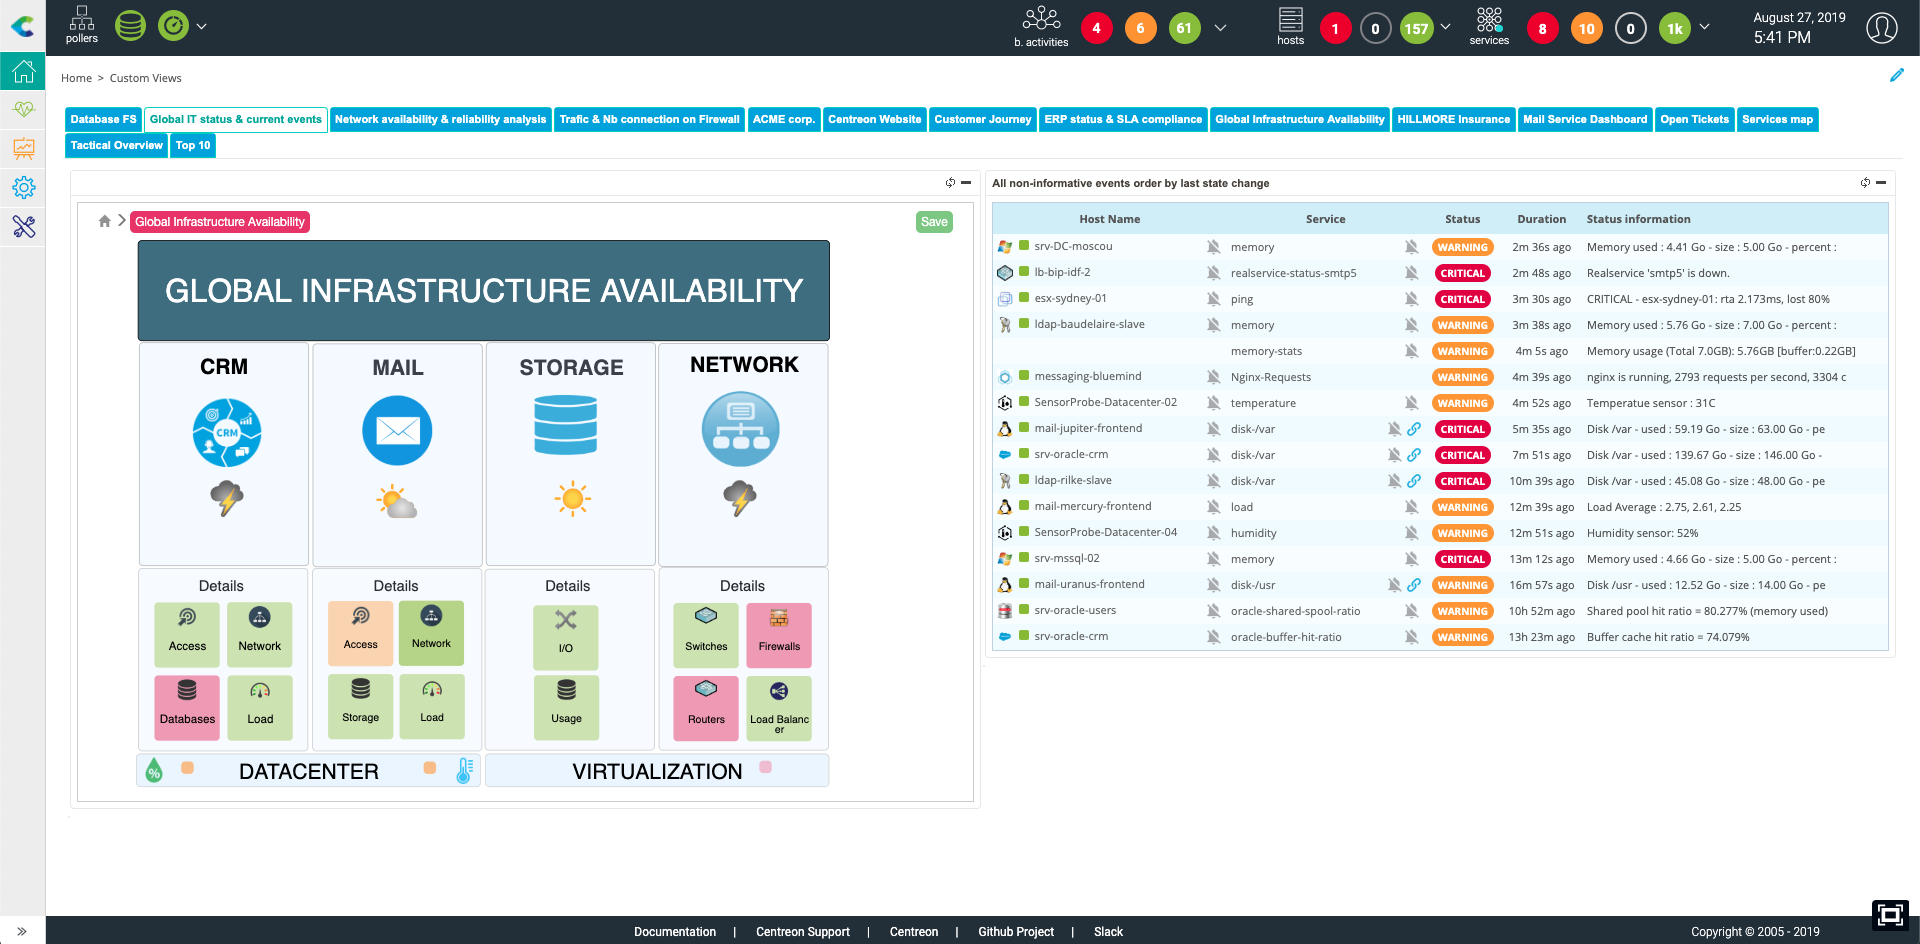
Below is an example of an IT infrastructure real-time status view created in 4 minutes or less:
Create a geographical view
If your IT is geographically spread over a city, country or even the world, you may want to view it in the most appropriate way to obtain insights into the status of your IT infrastructure.
This is easy to do using the GeoView. The only prerequisite is to have defined Geo-coordinate parameters on your hosts (which can be consulted and modified in the Configuration > Hosts > Hosts and Host Extended Infos tab).
To create a GeoView, go to Monitoring > Map and click the "+" that appears on the Geographic view line. If you do not see the "+", it means you do not have enough privileges on Centreon.
Display and share the view
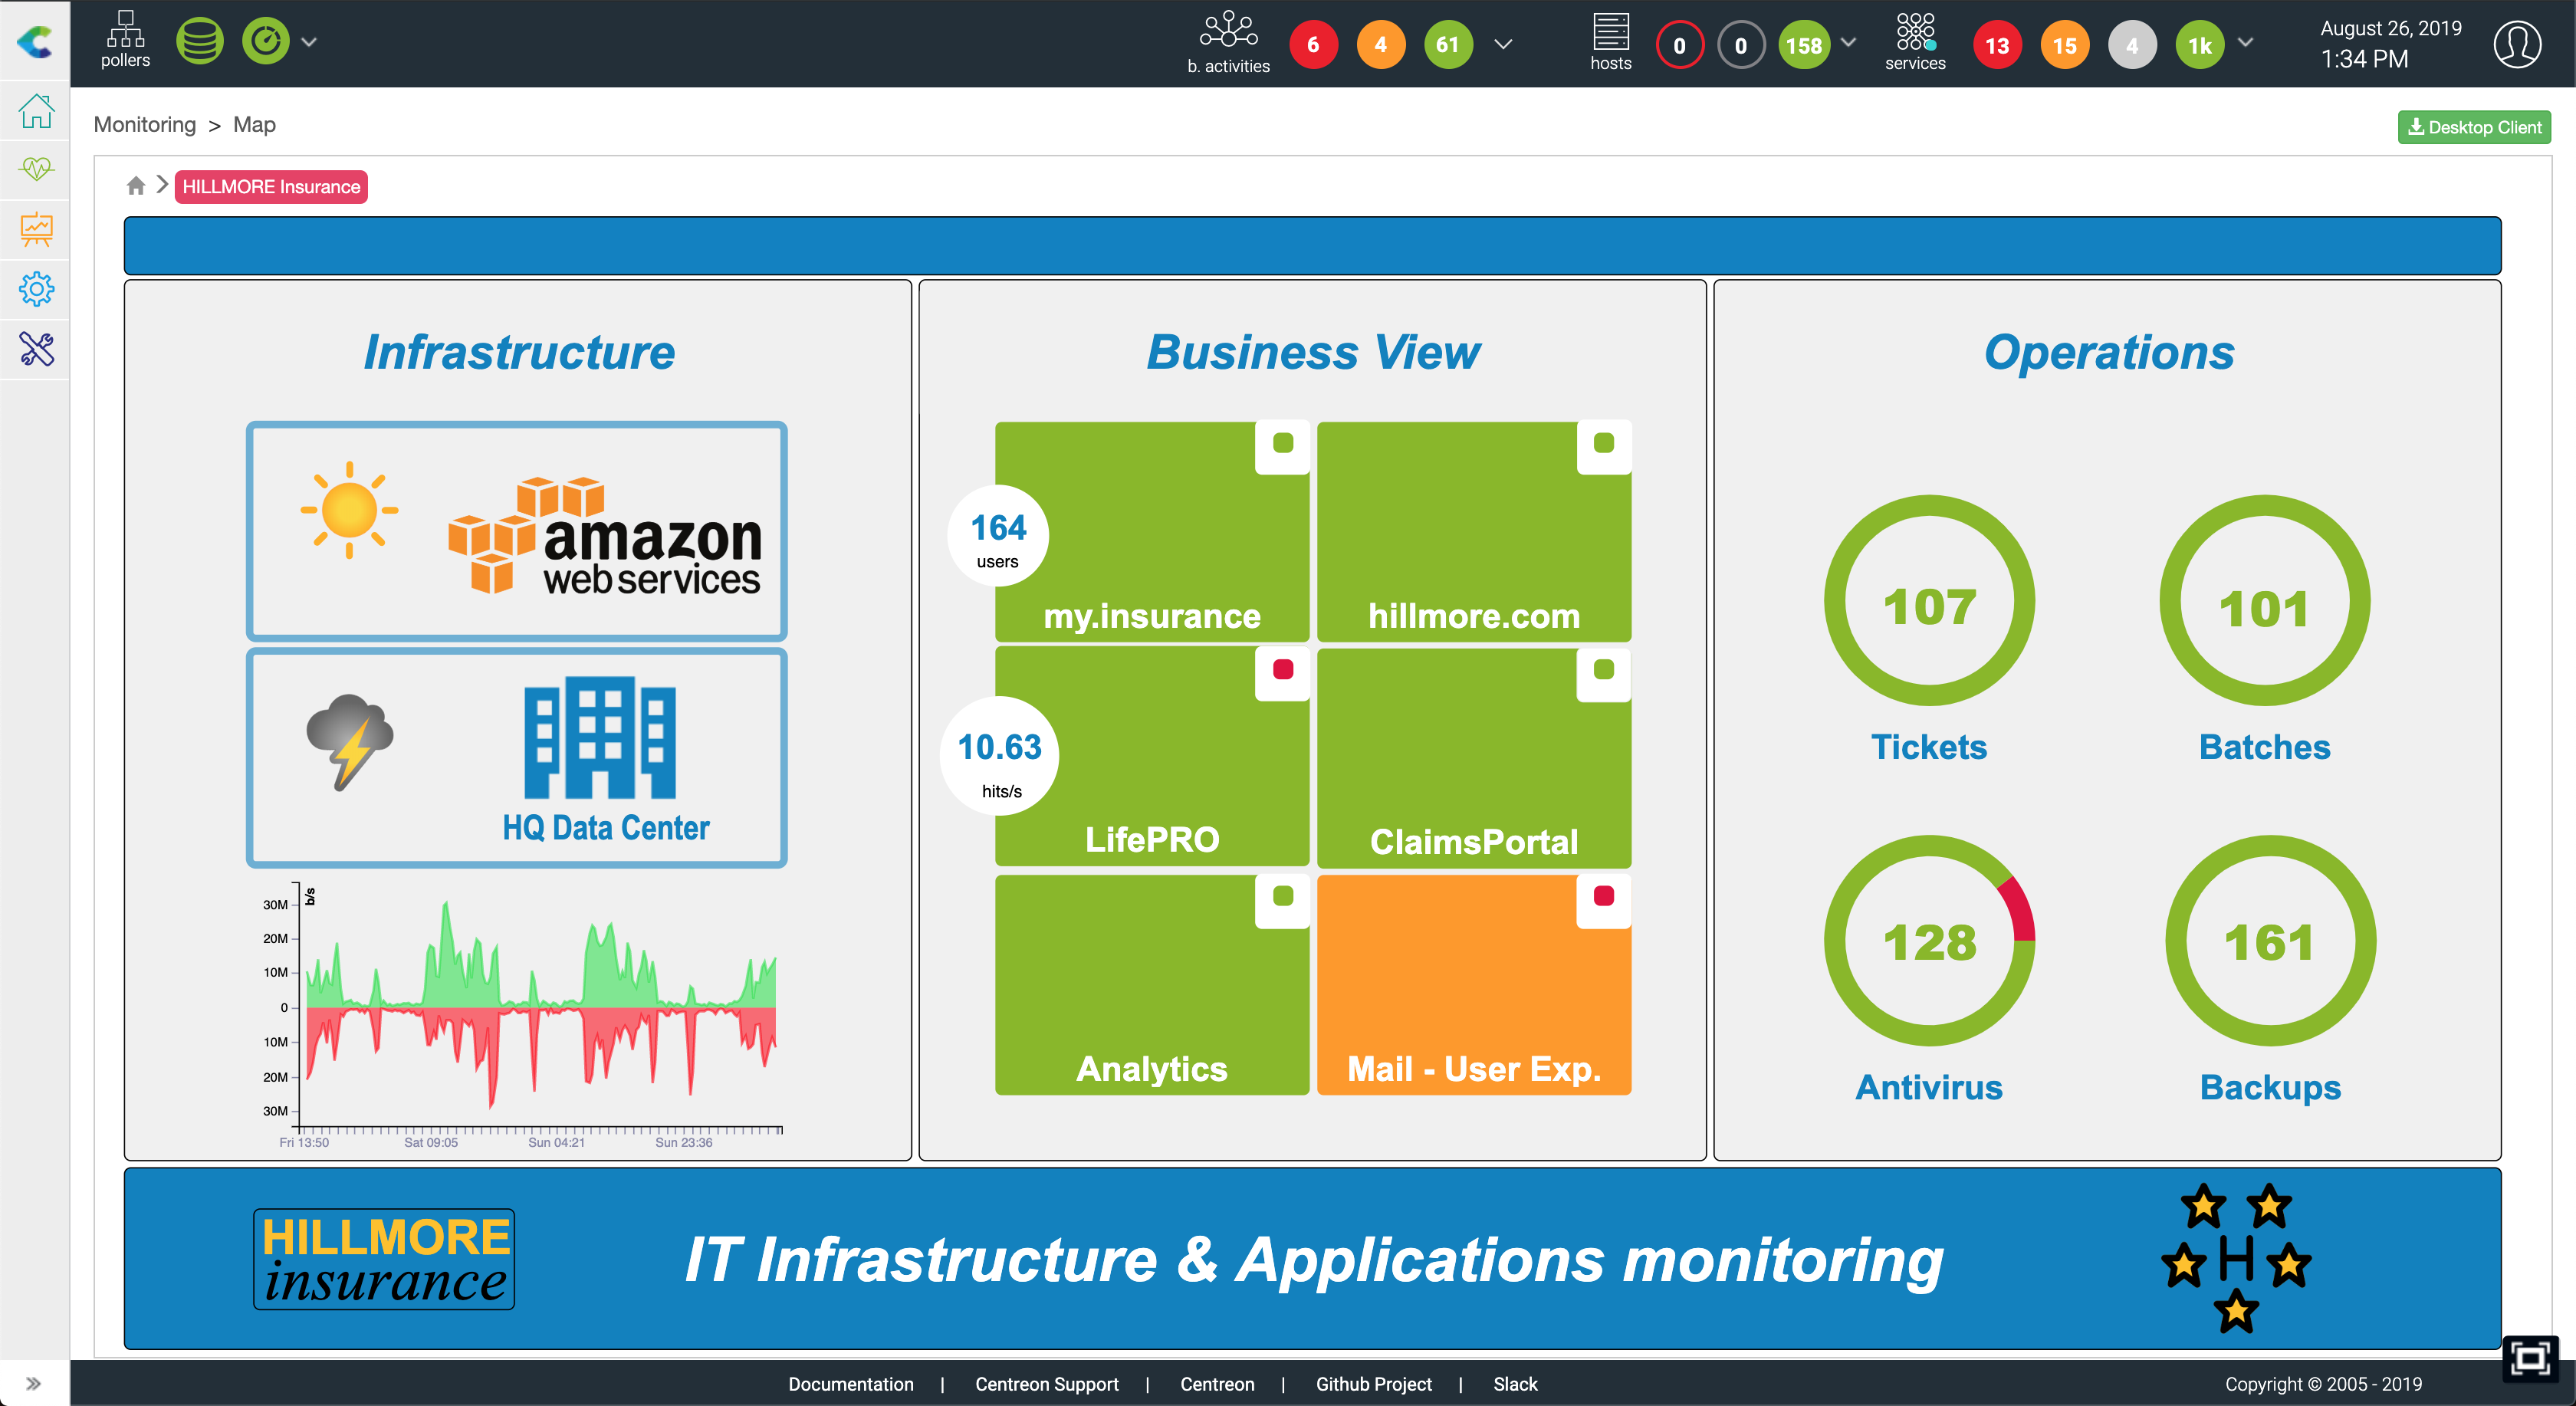
Using an access control mechanism based on Centreon ACL objects, it is easy to share the right views to the right teams. As soon as a view has been shared to a user, it is accessible through its browser in Centreon > Monitoring > Map or even directly on a dashboard using the Centreon Map widget (see example below).
You now have enough information to start working on Centreon Map.