Discover the Centreon web interface
First login
To connect to your Centreon web interface, go to URL: http://IP_ADDRESS/centreon. (Replace IP_ADDRESS with the IP address or FQDN of your Centreon web server.)
Enter your user name and password, and click the Connect button:
If you have installed Centreon from a VM, the default credentials are admin/Centreon!123. Otherwise, the default login is admin and the password is the one you defined in step 5 of the web installation wizard.
You are now connected to the Centreon web interface.
Menus
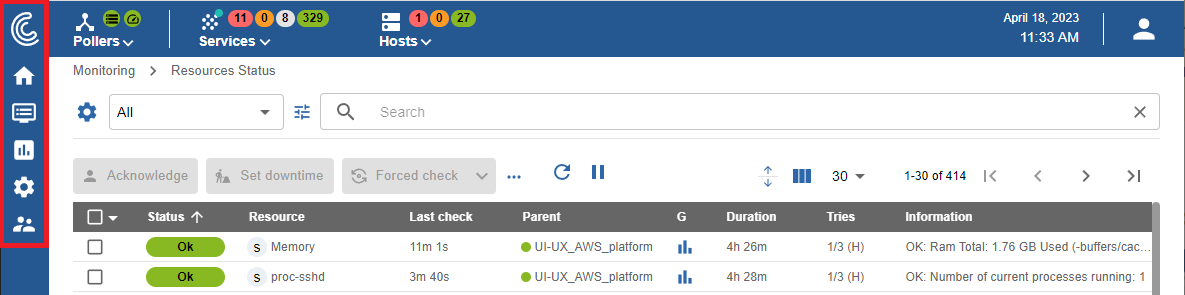
The Centreon web interface contains several menus, each with a specific function (click the Centreon logo at the top left of the screen to expand the menus):

- Home shows custom views. Your workspace may be blank for now. Once you configure customizable widgets, you will see data and charts according to your customization.
- Monitoring provides a combined view of the statuses of all monitored items in real and delayed time using logs and performance graphics.
- Reporting provides an intuitive view (using diagrams) of the evolution of monitoring over a given period.
- Configuration allows you to configure all monitored items and the monitoring infrastructure.
- Administration lets you access your user account.
Top banner
Pollers section
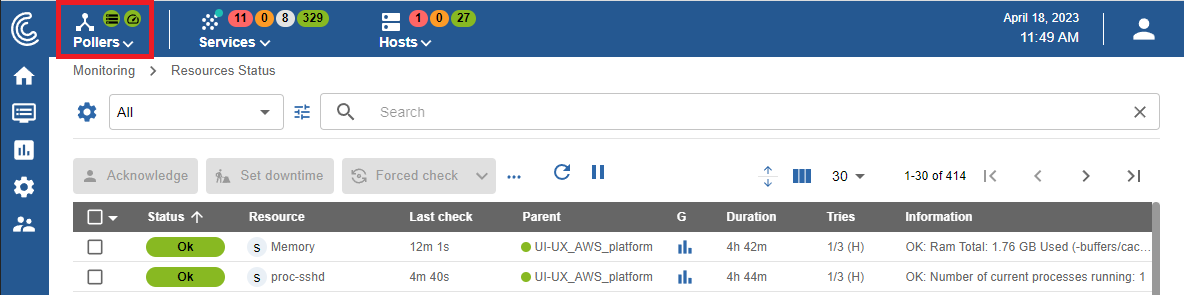
The left part of the top banner shows the health of your platform in real time:
- whether all pollers are running or not: the icon becomes red when a poller has not sent data to the central server for at least 15 minutes
- whether checks are running late or not. If the icon is orange or red, this may mean that your pollers are monitoring too many resources.
Click the pollers icon to expand the menu. On the menu, click Configure pollers to access page Configuration > Pollers > Pollers.
Hosts and services section (top counters)
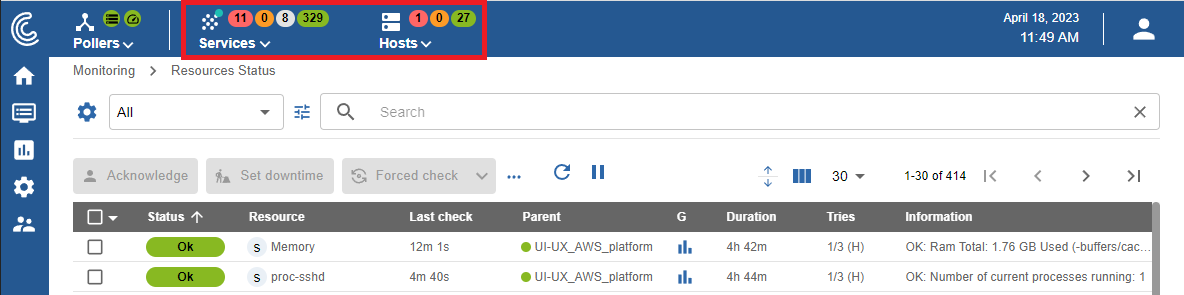
Beside the pollers section, statistics show the number of resources being monitored that have a specific status:
- For services: number of services with a Critical, Warning, Unknown and OK status.
- For hosts: number of hosts with a Down, Unreachable and Up status.
These numbers include unconfirmed (SOFT) alerts, but do not include resources that are acknowledged or in downtime. Pending resources are shown by a blue dot on the hosts or services icons.
Click a circle representing a status:
- The Monitoring > Resources status page opens.
- The page is filtered according to the type of resource and the corresponding status.
Click the hosts or services icon to expand the menu and display the details of the hosts and services.
Customization features
You can benefit from customization features for a better use of Centreon: