Model your IT services
Centreon Business Activity Monitoring (Centreon-BAM) is an extension for modeling IT services and applications, ideally, from an end user’s point of view. It reports on the status of aggregated indicators in real time, tracking any changes, thereby allowing you to measure results against business-oriented service level agreements (SLAs) with internal or external users.
Centreon BAM is a Centreon extension that requires a valid license key. To purchase one and retrieve the necessary repositories, contact Centreon.
Concept
Centreon BAM aggregates raw sets of resource statuses, called indicators, against which to measure business performance. These indicators collected by the Centreon monitoring system can be either a Centreon service, a logical rule between multiple services or any another business-centric monitoring indicator, called a Business Activity (BA).
You can use a BA as an indicator for another BA to create an impact tree and model the IT services or applications for analysis.
The evolution of a BA status will determine the quality of service (QoS) that reflects how well the application performs for its users. Based on this QoS rating, you can define the BA's operating levels and the SLA.
If a BA fails, the malfunction(s) that led to the drop in QoS can be analyzed and the SLA failure diagnosed.
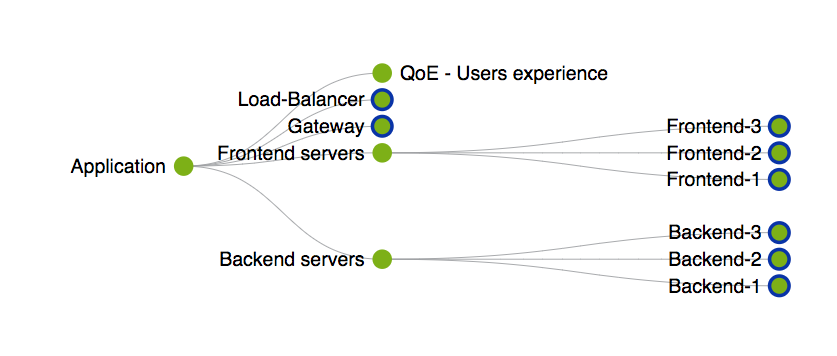
Below is an example of a business activity that correspond to a generic Application:
Introduction
Modeling a service or an application (that becomes a BA in Centreon's world) and its related indicators should be simple and methodical. Ideally, you should first include indicators that are directly related to the overall function of the service/applications and then gradually add other indicators that would have a potential impact on BA status.
All indicators added to a BA must initially be monitored one at a time by the system to determine the operational status of the BA.
The important thing to understand here is the way the business activity status will be computed. There are four calculation methods that can be used:
- Best status: When you only need to be warned that ALL indicators are critical at the same time
- Worst status: When you immediately want to know that at least 1 indicator is not-ok
- Ratio: When you want to model Cluster concepts by specifying a number of percentage of critical resources that you don't want to exceed
- Impact: When you want to precisely define the weight of each indicator and reflect that on your BA status
For more information, look at the calculation method explanations
Implementation method
The first step when you want to create a business activity is to have a clear view of the IT service, application, component you want to model. Don't hesitate to first model the Tree on a paper so that you'll just have to replicate the configuration in Centreon.
The way you think about an application or service IT may be Top-Down: you want to view the state of the Application > "A" .that relies on Network, Backend, Frontend clusters. These in turn rely on servers and network devices whose status relies on services monitored by Centreon
The way you create a business activity in Centreon is Bottom-up: you start by creating the down-level indicators that > represent server or network equipment status, then you aggregate them into Network, Frontend, Backend components and you finish by creating a Top level component to show the global Application "A" status.
Now that you know what application you want to model and what indicators this application relies on, you can sort them into two categories:
- Indicators known to have a blocking impact
- Indicators whose impact cannot be measured.
It's simpler to start by using only the blocking indicators. You'll be able to add more indicators later if you need to have BA status impacted more precisely.
Example
If we take a simple example: You have multiple frontend servers (10) and you want at least 20% of your servers to be available.
This will be done in two steps (bottom-up):
- First, define what's a frontend server that is OK: create business activities that correspond to frontend servers
- Then, define our cluster: create the business activity that will aggregate my frontend-x servers
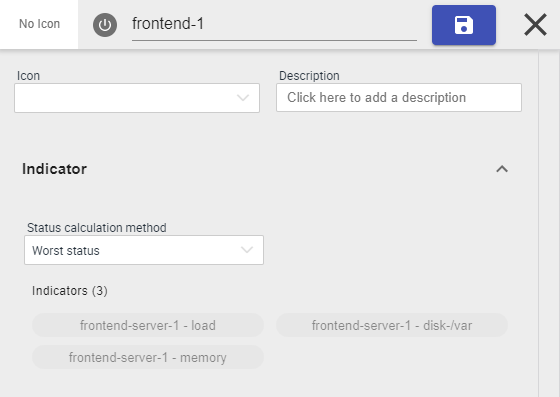
First, we create "Frontend-X" (business activity) corresponding to the frontend servers. Let's say that a frontend server that performs properly may be defined by:
- a Load below a critical state
- and a Disk usage below a critical state
- and a Swap usage below a critical state
So the state of a frontend-X is the Worst status of these 3 indicators. The first step is over; let's create a Frontend-1 business activity:
- Concept
- Configuration

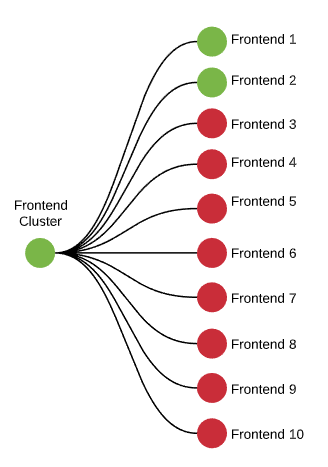
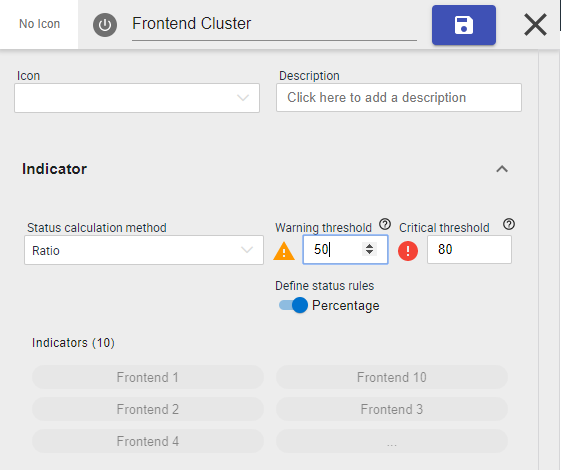
Now that we've defined our 10 frontend servers, we'll attach them to a parent business activity called "Frontends Cluster" so that it tells us whether or not we have 20% of Frontend servers available
- Concept
- Configuration
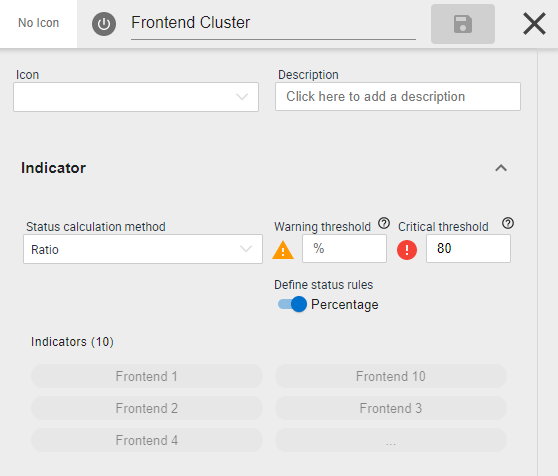
If we want to be proactive and NEVER go to 20%, we may add a Warning threshold to our Cluster business activity to be warned when 50% of the frontend servers are not available: just add "50%" to the Warning threshold:
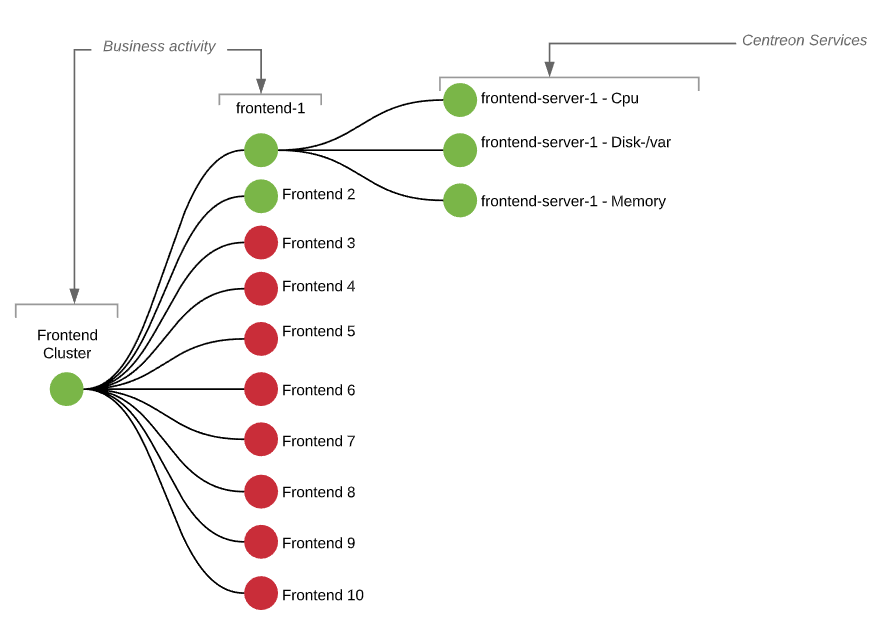
So, finally, we have combined multiple calculation methods, multiple types of resource, and our business activity will look like this:
Using the product on a daily basis helps to track the daily evolution of the BA to adjust indicators or rules that apply.
Reporting consideration
Now that you can proactively manage your IT services and application thanks to real-time BA tracking, it's time to look at availability and SLA.This is possible with the reporting capabilities and the Centreon MBI extension and the settings applied in the "Reporting" section of the BA.
How do we compare availability and SLA?
The final value of the SLA is linked to the time spent in OK, Warning / Critical conditions (downtime/uptime), which are visible in the Reporting screens.
Examples:
- 24/7 monitoring
- Over a 1-day period, the time spent in the status is as follows
- BA in OK status = 23 hours and 30 minutes
- BA in WARNING status = 10 minutes
- BA in CRITICAL status = 20 minutes
In this example, the following availability will be calculated:
- % Up and optimum performance ~ 97.91% (OK)
- % Up but degraded ~ 98.61% (OK+Warning)
- % Not available ~ 1.38% (Critical)
You can use the Centreon MBI extension to access advanced reporting capabilities on business activities data.