Graph template
Definition
Graph models are models that can be used to shape graph layouts. Graph models can be used to configure multiple presentation settings, including the y-axis measurement, the width and height of the graph, or colors, etc.
Configuration
Go to the Monitoring > Performances > Templates menu
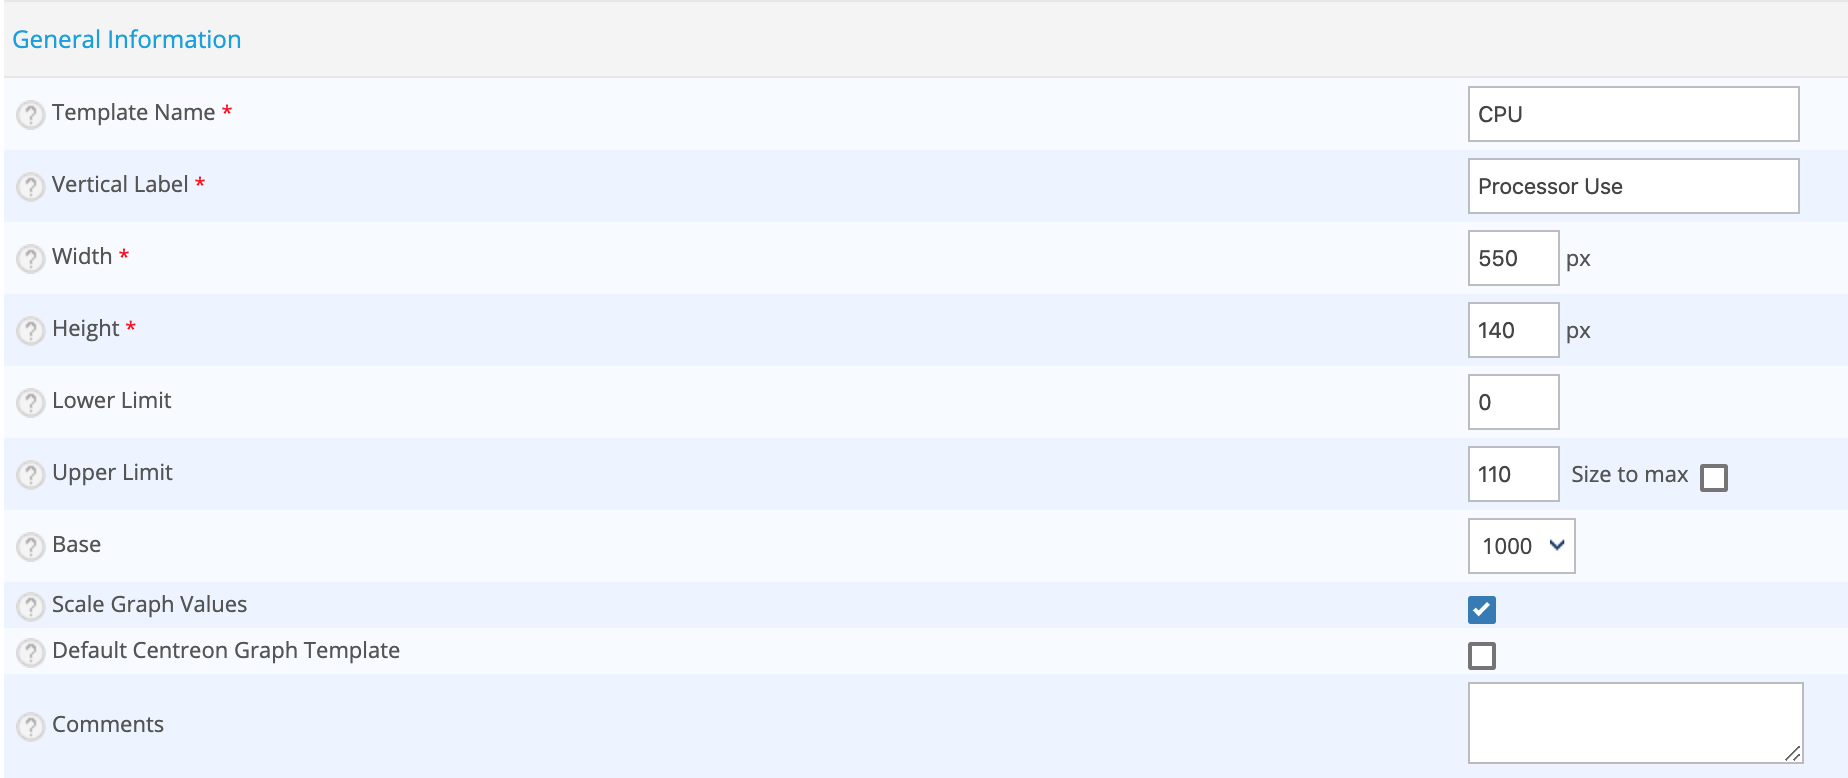
- The Template name field represents the name for the graph model
- The Vertical label field contains the legend for the y-axis (type of data measured).
- The Width and Height fields are expressed in pixels and express the width and the height of the model, respectively.
- The Lower limit field defines the minimum limit of the y-axis.
- The Upper limit field defines the maximum limit of the y-axis.
- The Base list defines the calculation base for the data during the scaling of the graph y-axis. Use 1024 for
measurements like bytes (1 KB = 1024 Bytes) and 1000 for measurements like the volt (1 kV = 1000 volts).
Regardless of the selected value, base 1024 will be used for the following metric units:
- B
- bytes
- bytespersecond
- B/s
- B/sec
- o
- octets
- The Scale Graph Values checkbox enables auto scaling of the graph, and bypasses previous options
- The Default Centreon Graph Template lets you display all charts without a predefined template using these values
If the Size to max box is checked, the graph will automatically be scaled to the scale of the maximum value ordinates shown on the given period.
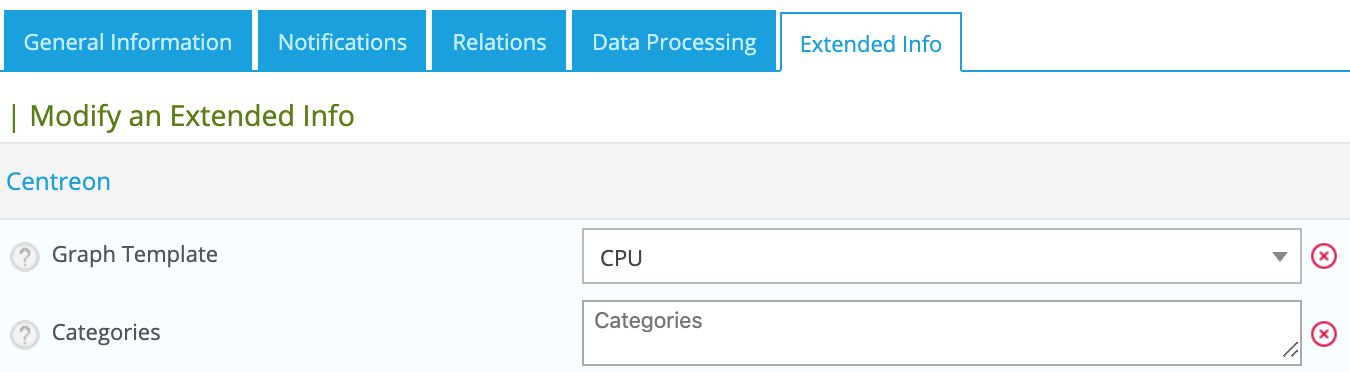
Using a graph template
You can add this layout model when editing a service (or a service template) by going into the Service Extended Info tab in configuration form: