Business Activity Monitoring reports
BV-BA-Availabilities-1
Description
This report displays statistics about application availability and events for a business view. It is generated using the default reporting time period for each business activity configured in the Centreon BAM module.
How to interpret the report
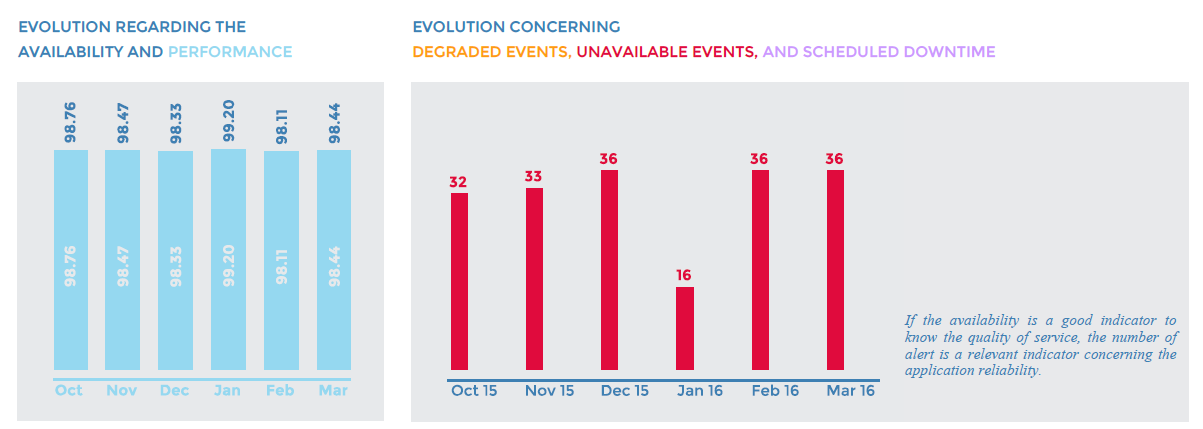
The first page presents a focus on the following attributes:
- Availability
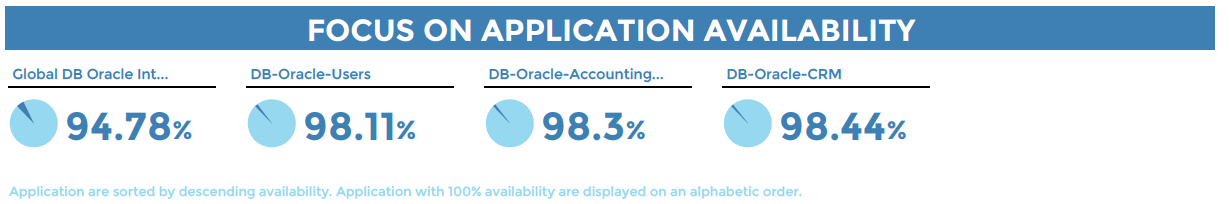
- Unavailability
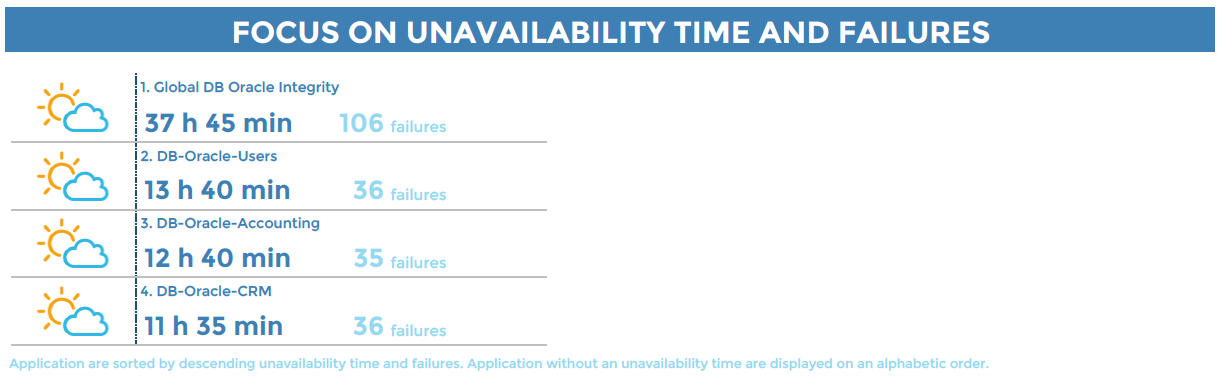
The weather icons change according to the SLAs defined in each business activity, in terms of minutes.
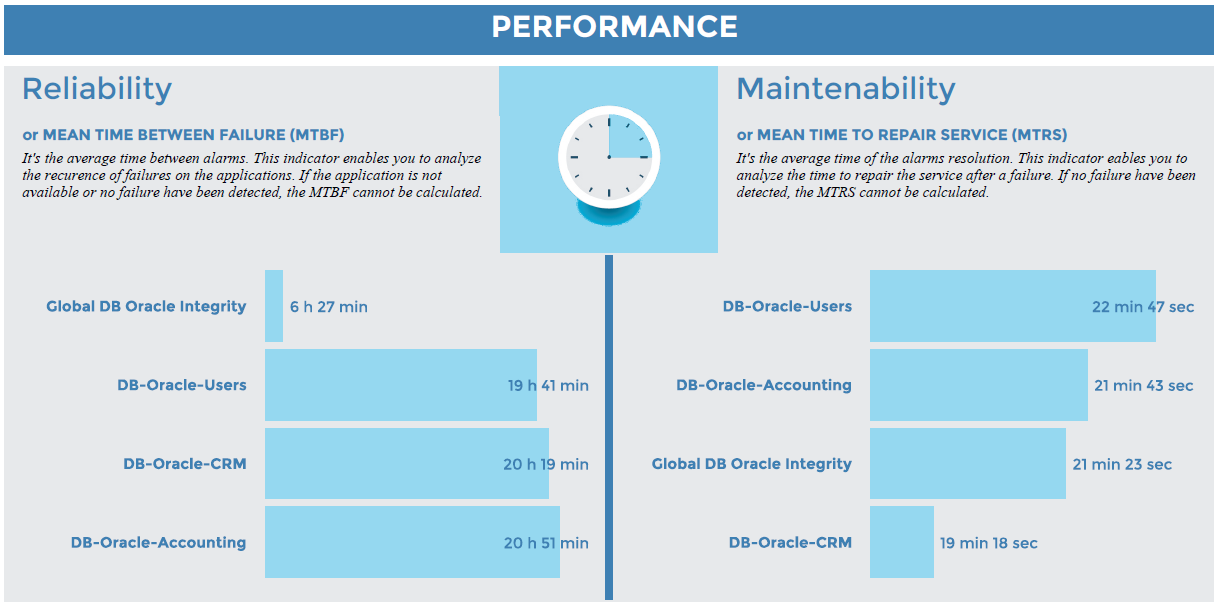
- Reliability and Maintainability
The following pages display additional statistics for each business activity in the business view:
- Availability, unavailability, downtime, service performance index and number of events that occurred.
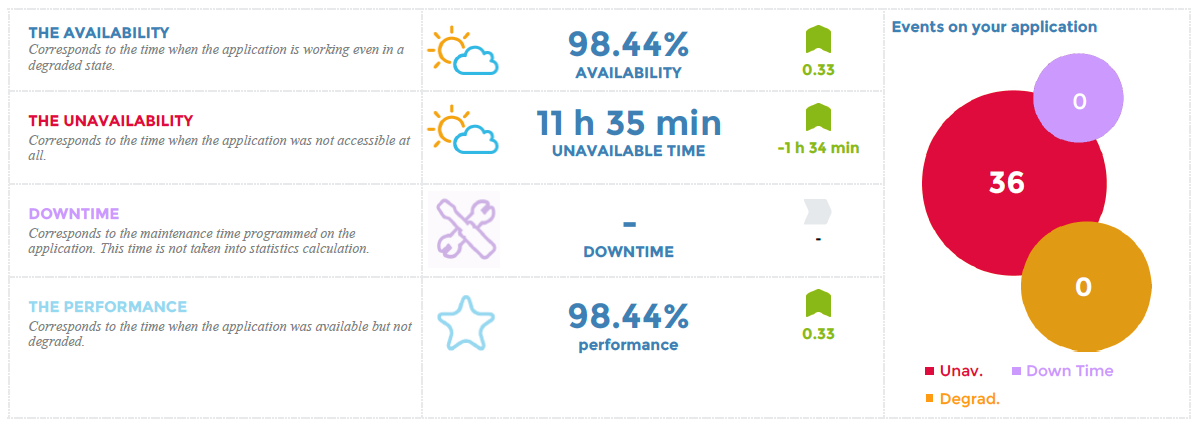
The weather icons change according to the SLAs defined in each business activity, in terms of percentages and minutes.
- Change in availability, performance and number of events.
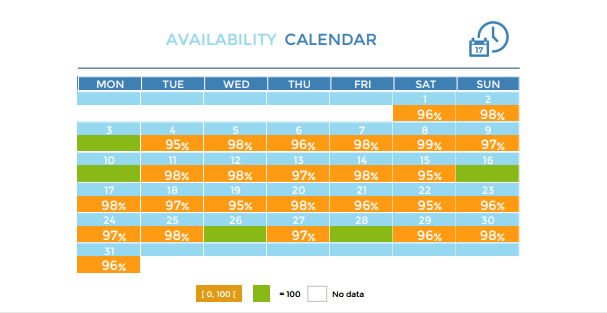
- An availability calendar displays only days when availability was below 100%.
- For days with 100% availability, the cell background color appears in a light gray with no values displayed.
- If data are not present on a specific day, the cell background color appears in white with no values displayed.
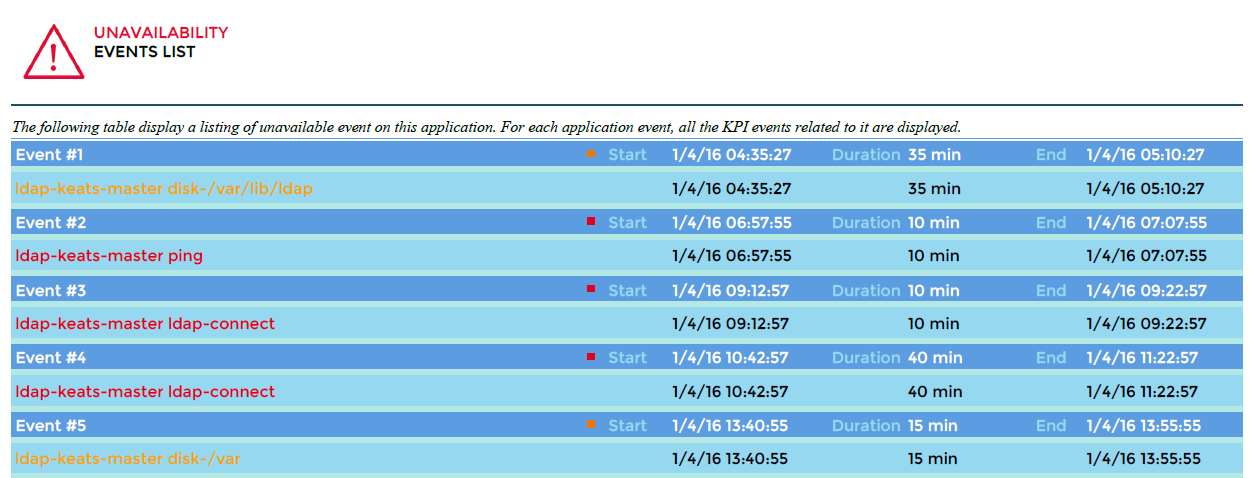
- As an option, the list of events appears with their respective key performance indicators (KPIs).
Parameters
Parameters required for the report:
- Start date representing the month in which you want to generate the report (matching the start date in the Centreon MBI interface)
- The following Centreon objects:
| Parameter | Type | Description |
|---|---|---|
| logo | Dropdown list | Select logo to display in header. |
| Business View | Dropdown list | Select a Business View for generating the report. |
| hide event | Radio button | Hide events list in the Business activity. |
| calendar color | Radio button | Color the calendar in green/orange/red based on SLA. |
| title | Text field | Specify report title. |
| time period | Dropdown list | Specify reporting time period.* |
* If different from "Default", be sure that the selected time period is defined as a Default or Extra reporting time period in the BA configuration or it will not appear in the report.
In the Time period field, do not use time periods that include exceptions, as the exceptions will not not be taken into account.
Prerequisites
- Monitoring of at least one business activity to be linked to one business view
- One month minimum of data from Centreon BAM module.
BA-Availability-1
This report displays statistics about business activity availability and events.
How to interpret the report
The following information is displayed on the report for the selected business activity:
- Availability, unavailability, downtime, service performance index and number of events.
The weather icons change according to the SLAs defined in each business activity, in terms of percentages and minutes.
- Change in the availability, performance and number of events
- An availability calendar displays only the days when availability was below SLA in terms of percentage defined in the business activity configuration.
- As an option, the list of events appears with their respective key performance indicators (KPIs).
Parameters
Parameters required for the report:
- Start date representing the month in which you want to generate the report (matching the start date in the Centreon MBI interface)
- The following Centreon objects:
| Parameter | Type | Description |
|---|---|---|
| logo | Dropdown list | Select logo to display in header. |
| Business Activity | Dropdown list | Select a Business Activity for generating the report. |
| hide event | Radio button | Hide events list in the business activity. |
| calendar color | Radio button | Color the calendar in green/orange/red based on SLA. |
| title | text field | Specify report title. |
| time period - Dropdown | Specify reporting time period.* |
* If different from "Default", be sure that the selected time period is defined as a Default or Extra reporting time period in the BA configuration.
In the Time period field, do not use time periods that include exceptions, as the exceptions will not not be taken into account.
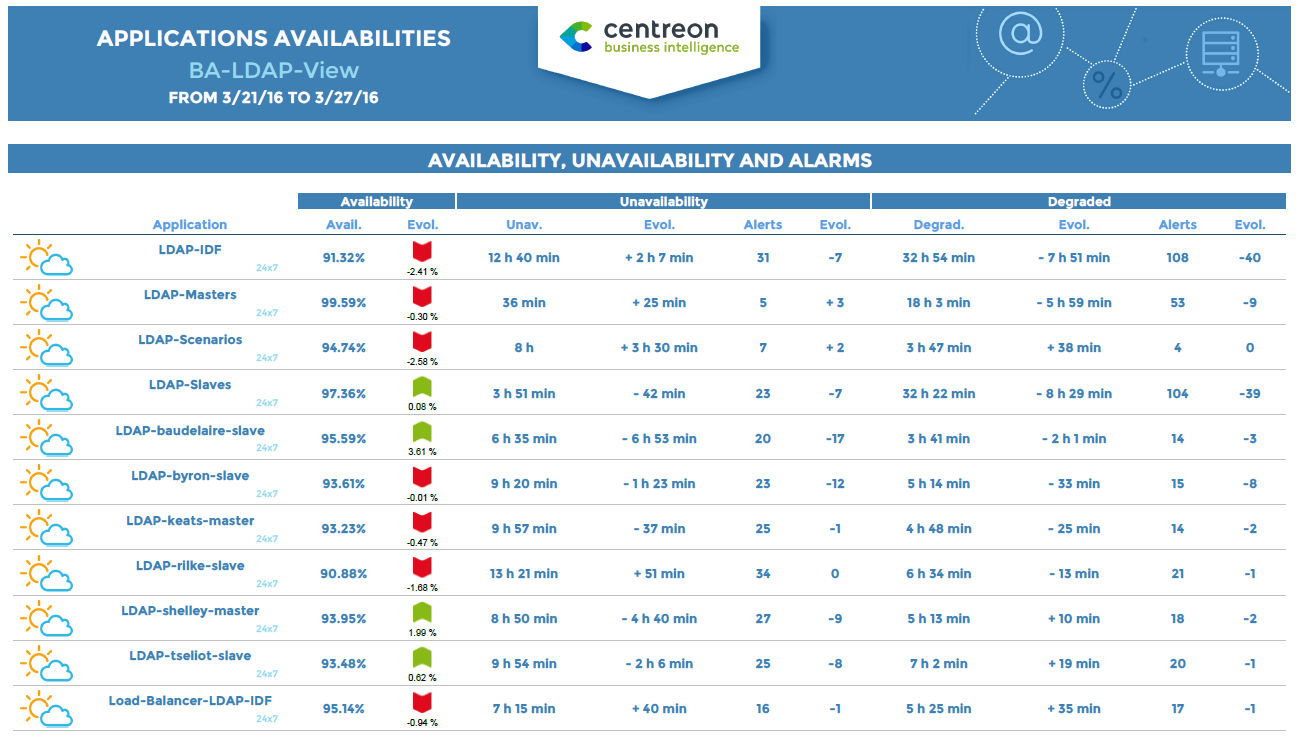
BV-BA-Availabilities-List
Description
For a business view, this report lists statistics showing availability, unavailability, degraded service time and business activity alarms.
How to interpret the report
The weather icons change according to the SLA percentage defined in each business activity. If no SLA is defined, 100% availability will be represented by a sun icon, and all values below 100% by a cloud.
Changes are calculated in relation to the previous period:
- If the reporting period is a full month, the previous period is the previous full month.
- In all other cases, the change is calculated by the number of days preceding the number of days of the reporting period.
Parameters required for the report:
- Start date representing the month in which you want to generate the report (matching the start date in the Centreon MBI interface)
- The following Centreon objects:
| Parameter | Type | Description |
|---|---|---|
| logo | Dropdown list | Select logo to display in header. |
| Business View | Dropdown list | Select a Business View for generating the report. |
| hide event | Radio button | Hide events list in the Business activity. |
| calendar color | Radio button | Color the calendar in green/orange/red based on SLA. |
| title | Text field | Specify report title. |
| time period | Dropdown list | Specify reporting time period.* |
* If different from "Default", be sure that the selected time period is defined as a Default or Extra reporting time period in the BA configuration or it will not appear in the report.
In the Time period field, do not use time periods that include exceptions, as the exceptions will not not be taken into account.
Prerequisites
- Monitoring of at least one business activity to be linked to one business view
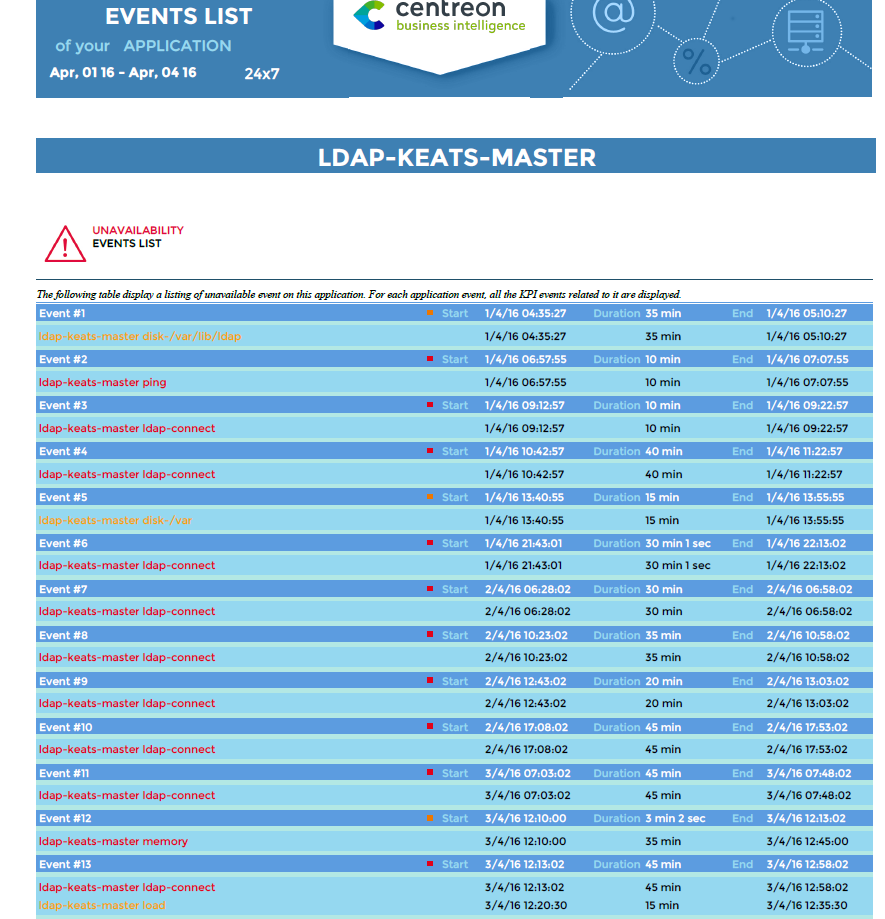
BA-Event-List
This report displays a list of events that occurred for a business activity.
How to interpret the report
The report displays a list of events for a business activity during a given period and the related KPIs. The time period applied is the default value set in the configuration BA menu.
Parameters
| Parameter | Type | Description |
|---|---|---|
| logo | Dropdown list | Select logo to display in header. |
| Business Activity | Dropdown list | Select a Business Activity for generating the report. |
| hide event | Radio button | Hide events list in the business activity. |
| calendar color | Radio button | Color the calendar in green/orange/red based on SLA. |
| title | text field | Specify report title. |
| time period | Dropdown | Specify reporting time period.* |
* If different from "Default", be sure that the selected time period is defined as a Default or Extra reporting time period in the BA configuration.
In the Time period field, do not use time periods that include exceptions, as the exceptions will not not be taken into account.
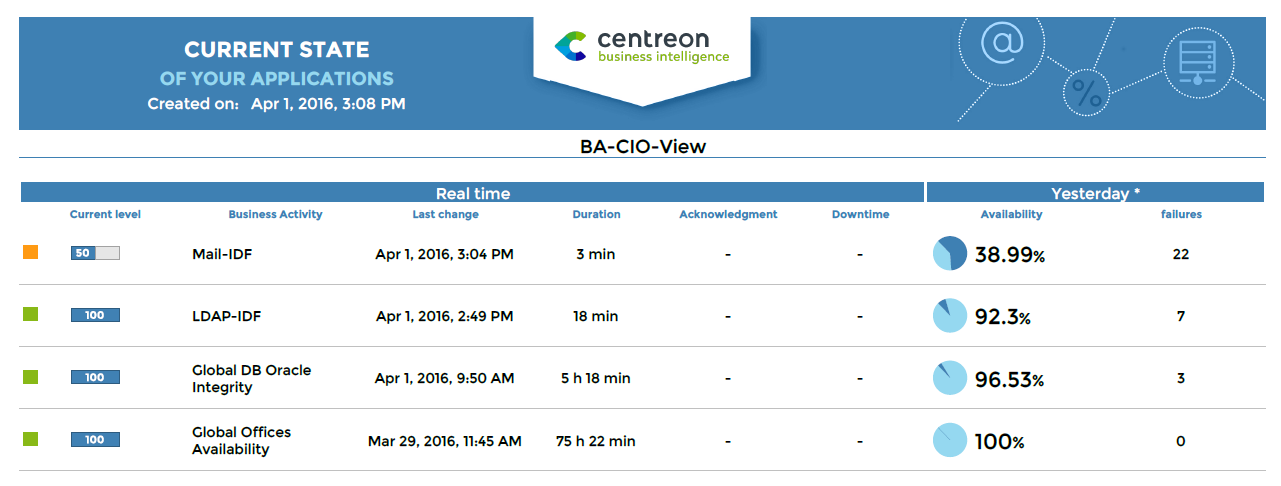
BV-BA-Current-Health-VS-Past
Description
This report displays the current health of business activities at the time the report is generated. It also displays availability for a defined period.
How to interpret the report
For a given business view, the report displays the real-time health state of each business application, the hour of latest state change and duration of the current state. The report also indicates whether the application has been acknowledged or in downtime. Depending on the parameter selected, the report displays availability and failures for each application.
Parameters
Parameters required for the report:
| Parameters | Type | Description |
|---|---|---|
| logo | List box | Select logo to display in header. |
| title | Text field | Specify report title. |
| Business View | List box | Select a Business View for generating the report. |
| compare_with | Radio button | Display historical data according to specified period. |
| show the reporting timeperiod | Radio botton | Show or hide the default time period related to the business activity. |
| title | Text field | Specify report title. |
| time period | Dropdown list | Specify reporting time period or other.* |
* If different from "Default", be sure that the selected time period is defined as a Default or Extra reporting time period in the BA configuration or it will not appear in the report.
In the Time period field, do not use time periods that include exceptions, as the exceptions will not not be taken into account.
Prerequisites
- Monitoring of at least one business activity to be linked to one business view.
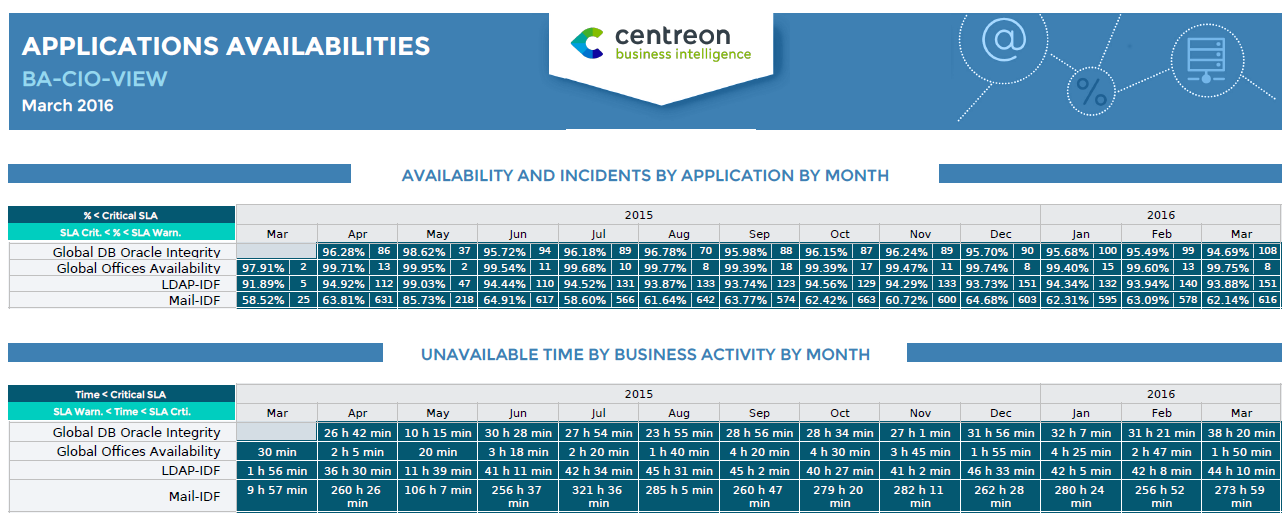
BV-BA-Availabilities-Calendars
Description
This report displays statistics about business activity availability and events. The statistics appear in calendars, by month and by day. This report is generated using the default reporting time period configured in the Centreon BAM module for each business activity.
How to interpret the report
The first calendar displays the availability of your business activities by month. Cells are colored according to the SLA defined for each business activity in percentages (in the Extended Information tab menu). If the SLAs are not defined in the BA configuration, values are displayed in cells if availability is below 100% or if unavailability > 0 seconds. The time period that applies is the "Default reporting period" selected for each business activity (in the Configuration tab menu).
The second calendar displays the unavailability and number of events for your business activities by month. Cells are colored according to the SLA defined for each business activity in minutes. If the SLAs are not defined in the BA configuration, values are displayed in cells if availability is below 100% or if unavailability > 0 seconds. The time period that applies is the "Default reporting period" selected for each business activity.
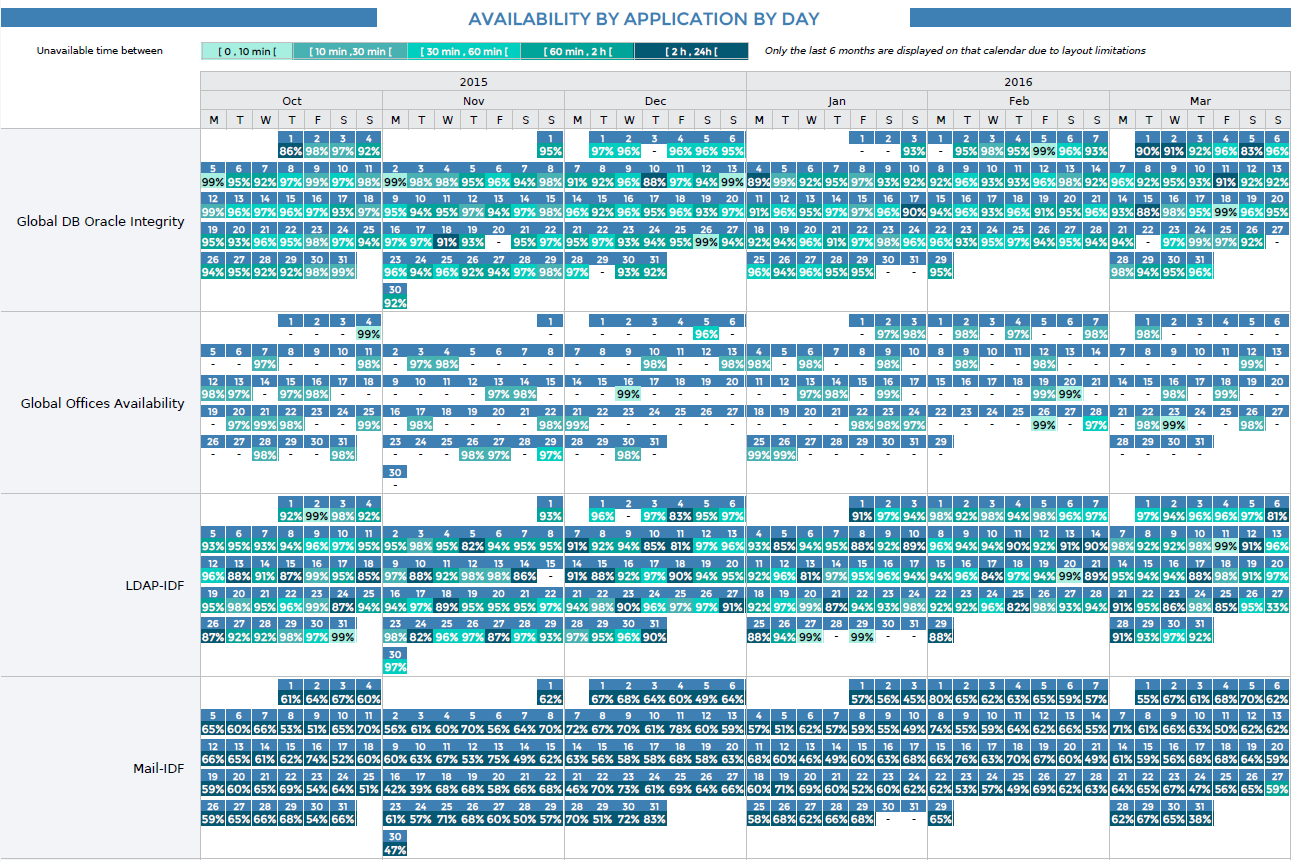
The third calendar displays availability for each business activity by day. Cells are colored according to time frames (in minutes) of unavailability, configured for the report. If unavailability is below 100%, availability is displayed for that day.
Parameters
Parameters required for the report:
- A start date corresponding to the month for which you want to generate the report (corresponding to the start date in the Centreon MBI interface)
- The following objects:
| Parameter | Type | Description |
|---|---|---|
| logo | Dropdown list | Select logo to display in header. |
| business View | Dropdown list | Select a Business View for generating the report. |
| sla 1* | Text field | Time in minutes corresponding to the high threshold of the first interval [0 min, sla1] |
| sla 2* | Text field | Time in minutes corresponding to the high threshold of the second interval [sla1, sla2] |
| sla 3* | Text field | Time in minutes corresponding to the high threshold of the third interval [sla2, sla3] |
| sla 4* | Text field | Time in minutes corresponding to the high threshold of the fourth interval [sla3, sla4] |
| title | Text field | Specify report title. |
| time period | Dropdown list | Specify reporting time period or a specific one.** |
* SLA thresholds appear above the calendar displaying availability by day.
![]()
* If different from "Default", be sure that the selected time period is defined as a Default or Extra reporting time period in the BA configuration or it will not appear in the report.
In the Time period field, do not use time periods that include exceptions, as the exceptions will not not be taken into account.
Prerequisites
- Monitoring of at least one business activity to be linked to one business view
- One month minimum of data from Centreon BAM extension.