Database diagnostics reports
Content-diagnostic
Description
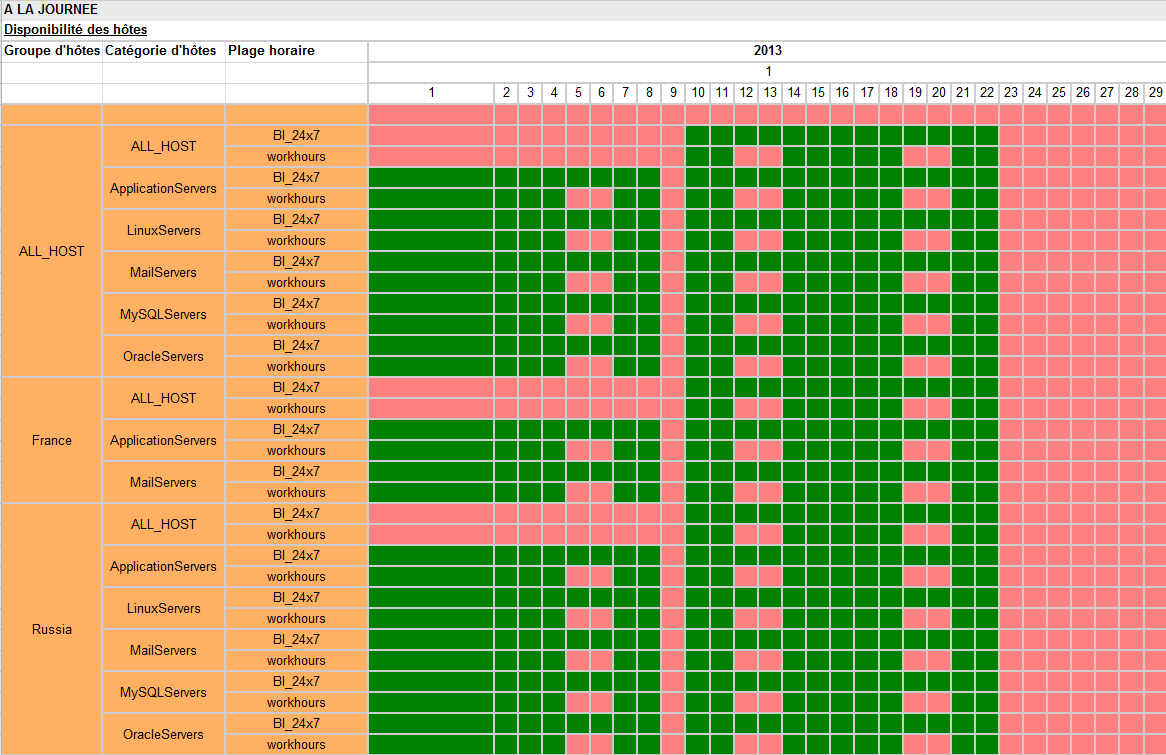
This report enables you to check whether availability and performance data aggregated by days and months are present in the database.
Color coding is used to display data by host group, host category and time period.
- Green = a value is available
- Red = no value is available
This report does not describe data quality, only data availability.
Parameters
Parameters required for the report:
- The reporting period
- The following Centreon objects:
| Parameter | Parameter type | Description |
|---|---|---|
| Host group | Multi select | Select host group. |
| Service Categories | Multi select | Select service category. |
| Host Categories | Multi select | Select host category. |
| Metrics | Multi select | Specify metrics for filtering. |
Content-diagnostic-availability
Description
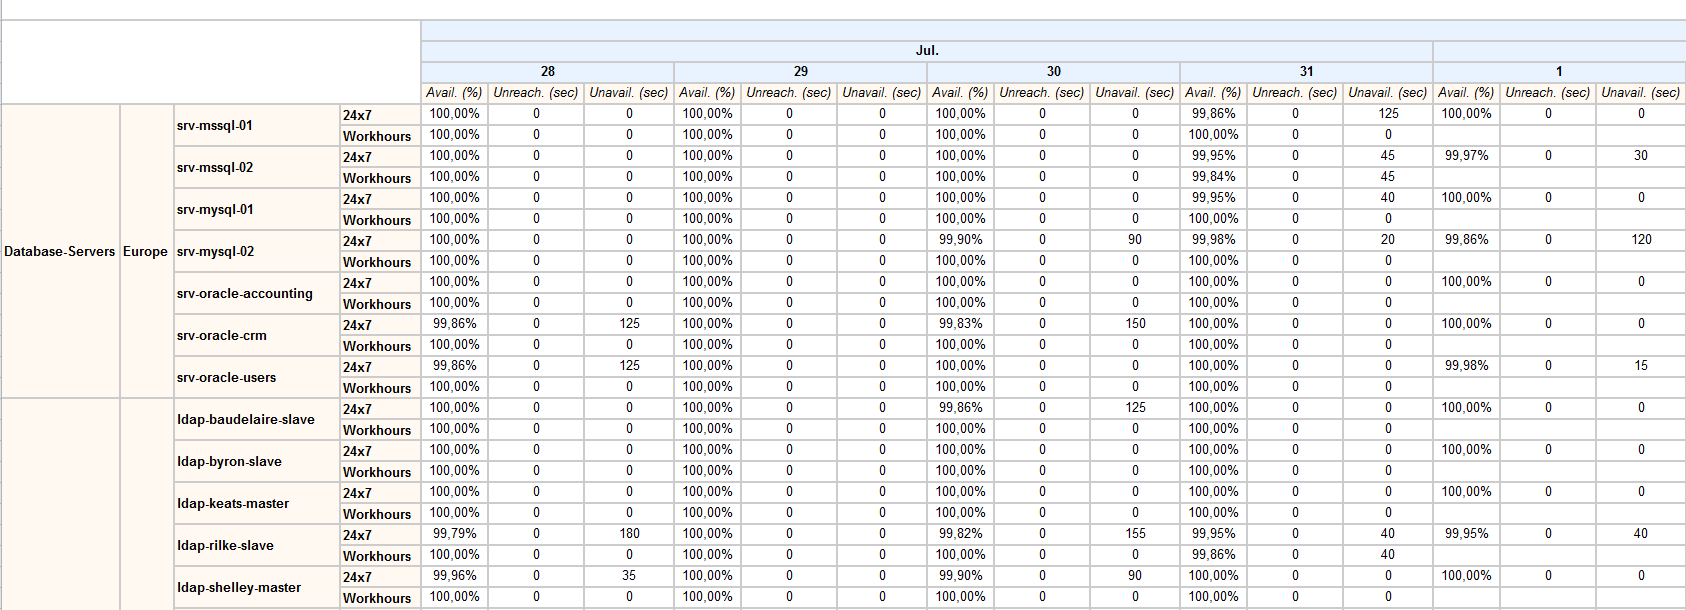
This report provides a calendar view of host availability, displaying the following information: availability of each host by day, unavailability and unreachability. This data is shown for each time period and organized by group and category.
Parameters
Parameters required for the report:
- The reporting period
- The following Centreon objects:
| Parameter | Parameter type | Description |
|---|---|---|
| Host group | Drop-down list | Select host group. |
| Hosts Categories | Multi select | Select host categories. |
Content-diagnostic-service-availability
Description
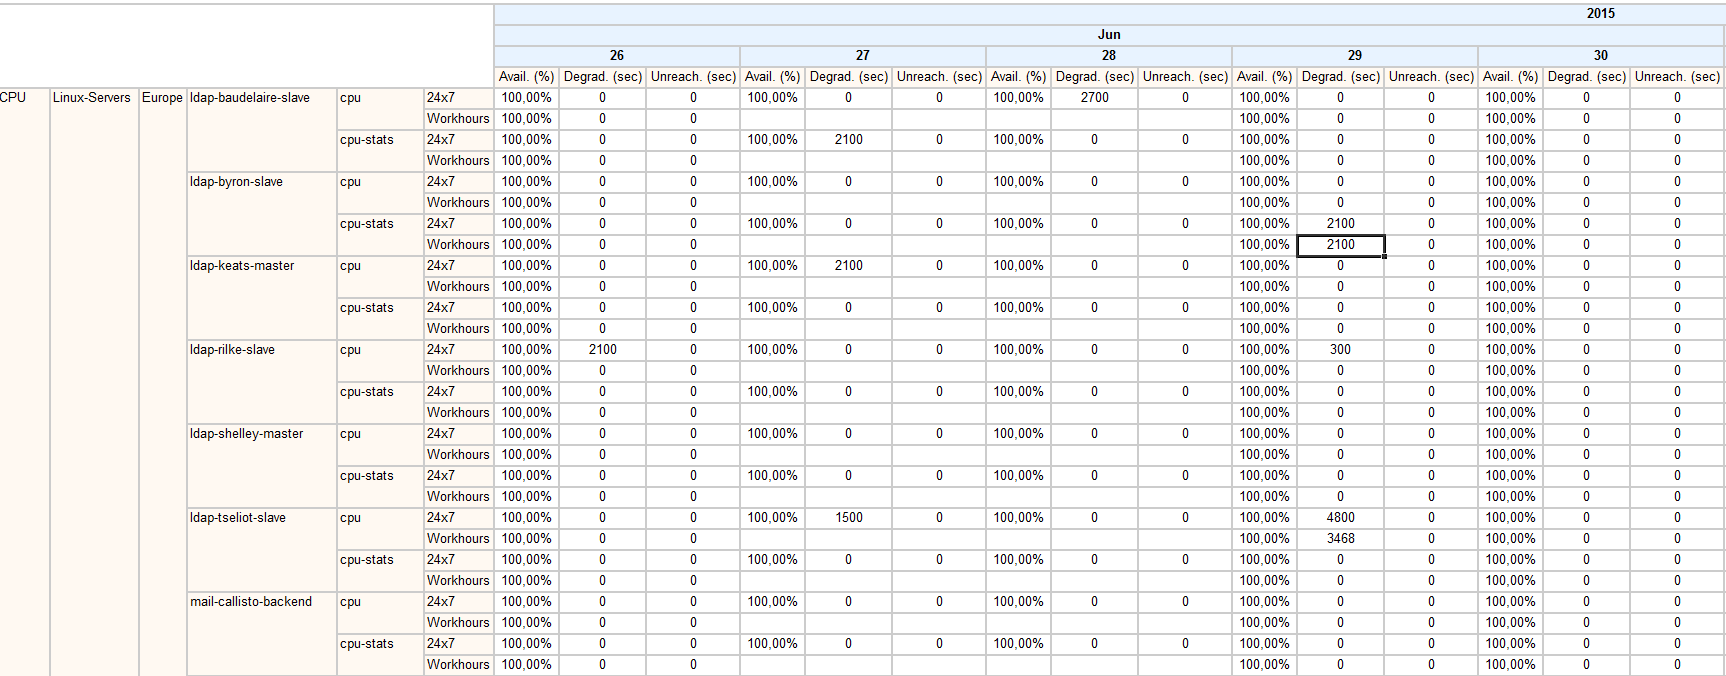
This report provides a calendar view of service availability, displaying the following information: availability for each service by day, warning time and critical time. This data is shown for each time period and organized by group, host category and service category.
Parameters
Parameters required for the report:
- The reporting period
- The following Centreon objects:
| Parameter | Parameter type | Description |
|---|---|---|
| Host group | Drop-down list | Select host group. |
| Hosts Categories | Multi select | Select host categories. |
| Service Categories | Multi select | Select service categories. |
Content-diagnostic-performance
Description
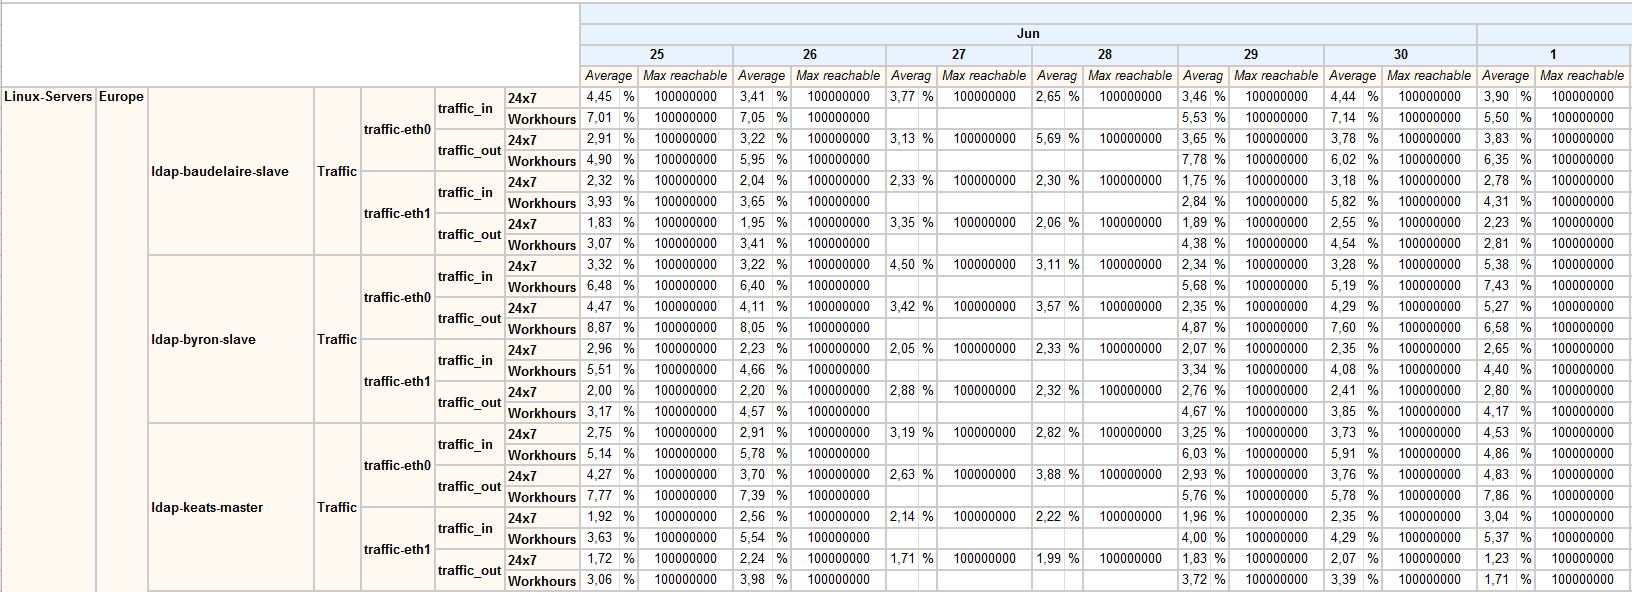
This report provides a calendar view of average values by metrics and time periods. It also indicates the maximum value reachable for each metric. Data is organized by group, host and service categories.
Parameters
Parameters required for the report:
- The reporting period
- The following Centreon objects:
| Parameter | Parameter type | Description |
|---|---|---|
| Host group | Drop-down list | Select host group. |
| Hosts Categories | Multi select | Select host categories. |
| Service Categories | Multi select | Select service categories. |
| Metrics | Multi select | Select metrics to include |
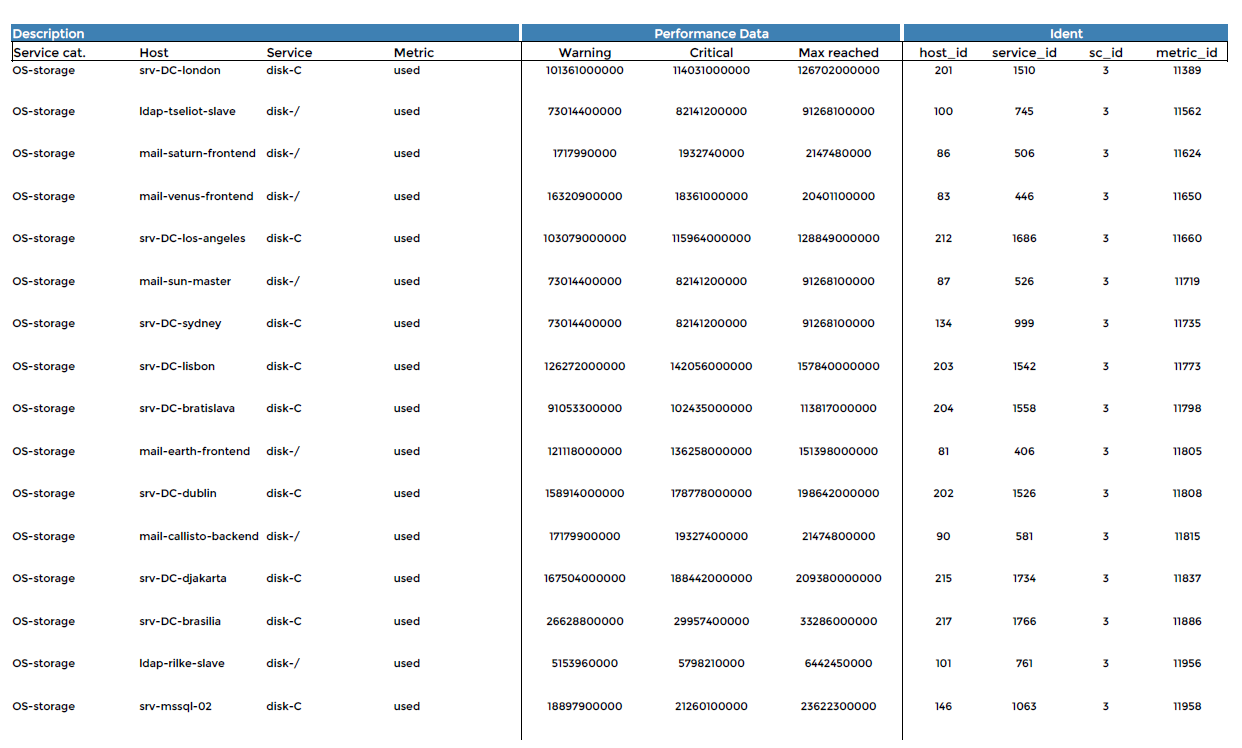
Metric-integrity-check
Description
This report checks the compatibility between the plugins/metrics and the MBI performance reports. It allows you to quickly identify incompatible services and to update the plugins.
How to interpret the report
If a warning is displayed on a line:
- Warning and Critical thresholds are not set.
- The maximum value was not returned by the plugin.
Parameters
Parameters required for the report:
- The reporting period
- The following Centreon objects:
| Parameter | Parameter type | Description |
|---|---|---|
| Service Categories | Multi select | Select service categories. |
| Metrics | Multi select | Select metrics to include |