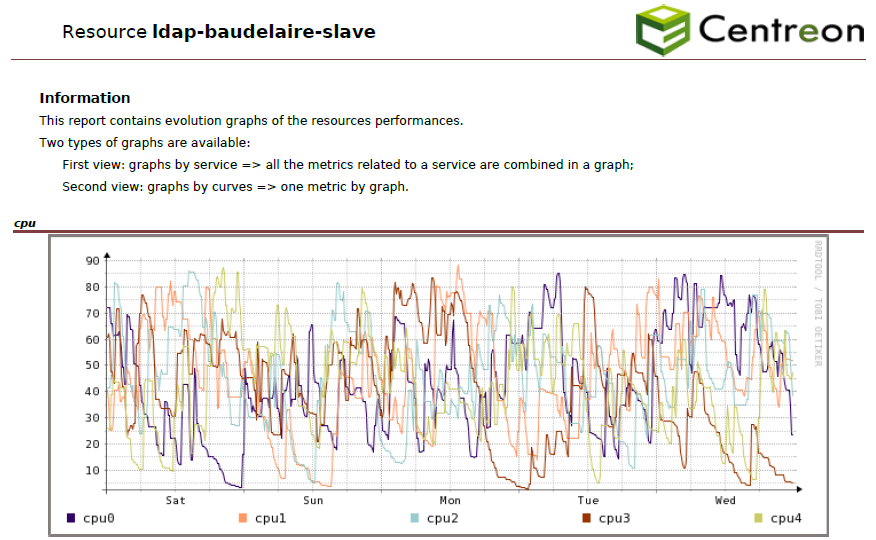
Performance reports
Host-Graphs-V2
Description
This report presents round-robin database (RRD) graphs for the evolution and performance of Centreon services over a defined period.
Parameters
Parameters required for the report:
- Reporting period
- The following Centreon objects:
| Parameter | Parameter type | Description |
|---|---|---|
| Host | Selection | Select host. |
| Service Categories | Multi select | Select service category. |
| Metrics | Multi select | Metrics to use. If no metric is selected, graphs by metric will not displayed. |
| Graphs display rule | Check box | Sets whether you want to see all the metrics on one graph for each service, one graph per metric, or both. |
Prerequisites
Go to Reporting > Business Intelligence > General Options > Scheduler Options and configure the following field:
![]()
In order to export RRD graphs using the Centreon API, the reporting server needs to access it using HTTP or HTTPS protocol. A curl command sent to the URL of the API should generate an image file.
curl http://$CENTREON-IP-OR-DNS$/centreon/include/views/graphs/generateGraphs/generateImage.php?akey=$AUTH_KEY$&username=$USER$&hostname=$HOSTNAME$&service=$SERVICENAME$&start=$TIMESTAMPSTART$&end=$TIMESTAMPEND$
Replace the values between $ signs with real values.
Example:
curl http://centreon.enterprise.com/centreon/include/views/graphs/generateGraphs/generateImage.php?akey=af9c583c5f31bd2459c07&username=myUser&hostname=host-1&service=cpu&start=1490997600&end=1493157600
If you are using SSL/TLS on your Central server, and if the certificate is self-signed or signed by an unknown authority, you must add it to the trusted certificates database:
Install ca-certificates package:
yum install -y ca-certificatesRetrieve and store certificate:
echo quit | openssl s_client -showcerts -servername <hostname> -connect <hostname>:<port> > /etc/pki/ca-trust/source/anchors/<hostname>.pemThe servername option value must be the exact hostname defined in the certificate. It must also be the hostname defined in Centreon Web configuration, and used by the reports scheduler to contact the Central server.
Reload the trusted certificates database:
update-ca-trustCBIS must be restarted after these actions.
Hostgroup-Graphs-v2
Description
This report presents round-robin database (RRD) graphs for the evolution and performance of Centreon services for a given host group over a defined period.
Parameters
Parameters required for the report:
- Reporting period
- The following Centreon objects:
| Parameter | Parameter type | Description |
|---|---|---|
| Report title | Text | Select title on cover page and report header. |
| Host group | Drop-down list | Select host group. |
| Service Categories | Multi select | Select service category. |
| Hosts Categories | Multi select | Select host categories. |
| Metrics | Multi select | Select metrics. If no metric is selected, graphs by metric will not be displayed. |
| Graphs display rule | Check box | Specify whether you want to see all the metrics on one graph for each service, a graph by metric, or both. |
Prerequisites
Go to Reporting > Business Intelligence > General Options > Scheduler Options and configure the following field:
![]()
In order to export RRD graphs using the Centreon API, the reporting server needs to access it using HTTP or HTTPS protocol. A curl command sent to the URL of the API should generate an image file.
curl http://$CENTREON-IP-OR-DNS$/centreon/include/views/graphs/generateGraphs/generateImage.php?akey=$AUTH_KEY$&username=$USER$&hostname=$HOSTNAME$&service=$SERVICENAME$&start=$TIMESTAMPSTART$&end=$TIMESTAMPEND$
Replace the values between $ signs with real values.
Example:
curl http://centreon.enterprise.com/centreon/include/views/graphs/generateGraphs/generateImage.php?akey=af9c583c5f31bd2459c07&username=myUser&hostname=host-1&service=cpu&start=1490997600&end=1493157600
If you are using SSL/TLS on your Central server, and if the certificate is self-signed or signed by an unknown authority, you must add it to the trusted certificates database:
Install ca-certificates package:
yum install -y ca-certificatesRetrieve and store certificate:
echo quit | openssl s_client -showcerts -servername <hostname> -connect <hostname>:<port> > /etc/pki/ca-trust/source/anchors/<hostname>.pemThe servername option value must be the exact hostname defined in the certificate. It must also be the hostname defined in Centreon Web configuration, and used by the reports scheduler to contact the Central server.
Reload the trusted certificates database:
update-ca-trustCBIS must be restarted after these actions.
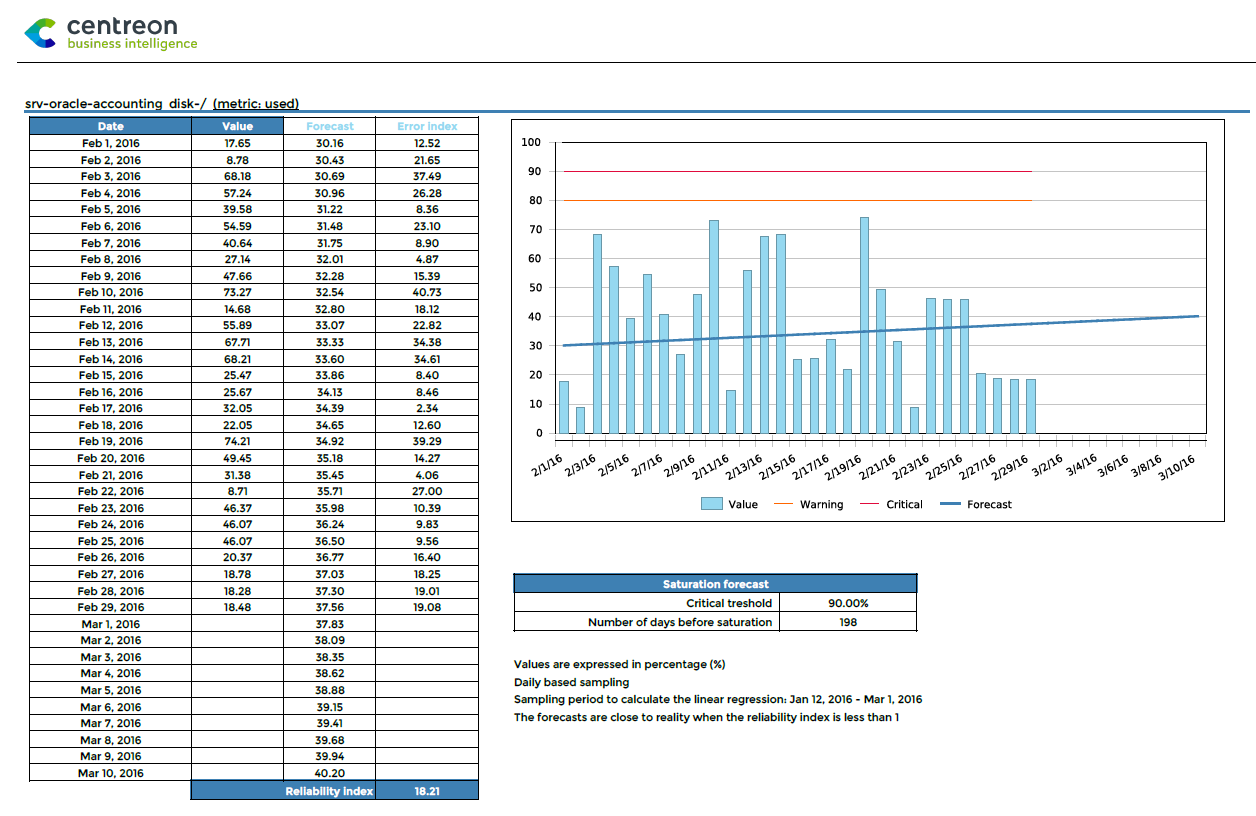
Hostgroup-Capacity-Planning-Linear-Regression
Description
This report shows the evolution and performance forecasting metrics for a host group.
How to interpret the report
The evolution of the value of the metric is represented on a graph and in a table. Forecasts are calculated from the value of the metric during the reporting period and projected into the future. An additional table provides information about critical threshold and days before saturation.
Parameters
Parameters required for the report:
- Reporting period
- The following Centreon objects:
| Parameter | Parameter type | Description |
|---|---|---|
| Host groups | Multi select | Select host groups for filter. |
| Host Categories | Multi select | Select host categories for filter. |
| Services Categories | Multi select | Select service categories for filter. |
| Time period | Dropdown list | Specify time period. |
| Metrics | Multi select | Select metric to include in report. |
| Historical period in days in addition to the reporting period | Number | Specify days used to calculate the linear regression before reporting period. |
| Forecast period in days | Number | Specify forecast days calculated by linear regression. |
Prerequisites
Metrics must return a maximum value on their performance data. Using warning and critical thresholds on performance data is highly recommended.
Performance data returned by a plugin must be formatted as follows, preceded by a pipe (|):
output-plugin | metric1=valeur(unité);seuil_warning;seuil_critique;minimum;maximum metric2=valeur ...
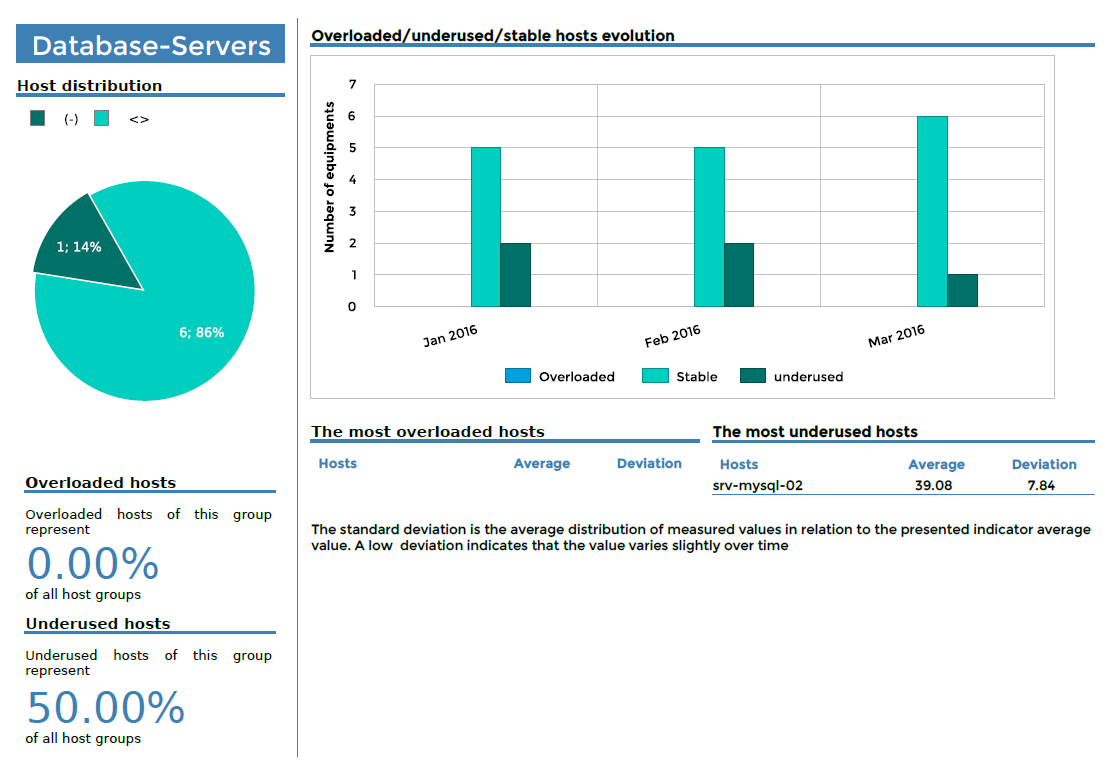
Hostgroups-Rationalization-Of-Resources-1
Description
This report provides an overview of resource usage by host groups and displays hosts and host groups that are overloaded or underused.
On the first page, this information is displayed for all host groups.
Then, for each host group a separate page is generated showing load distribution.
Summary page
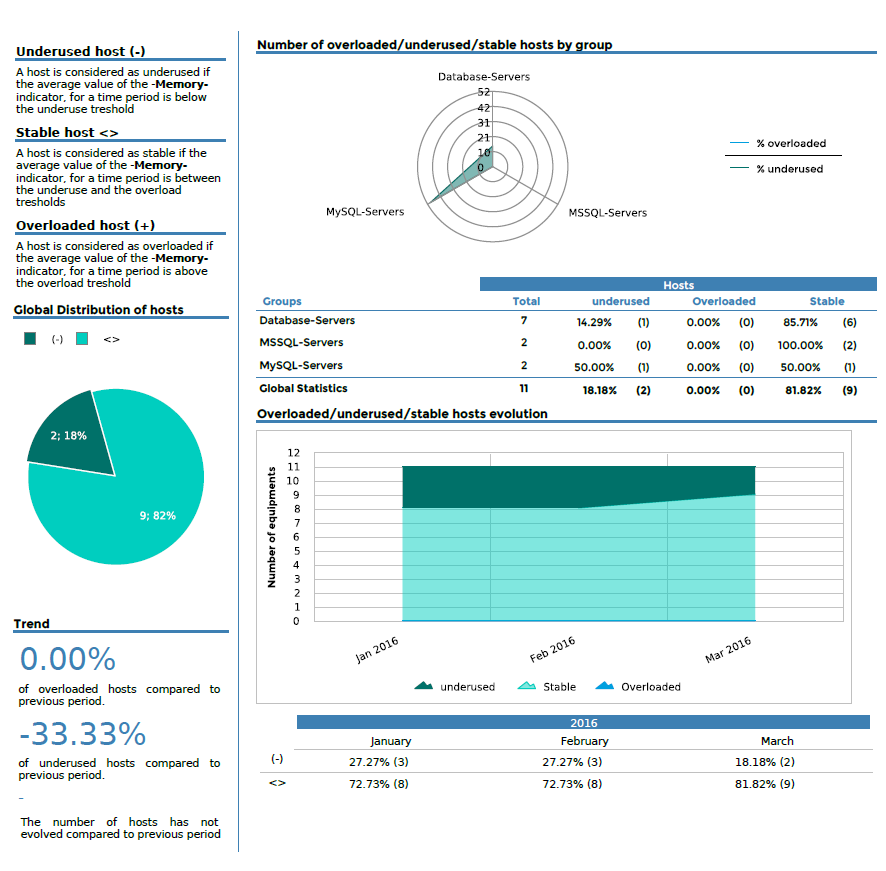
For each host group
Parameters
Parameters required for the report:
- Reporting period
- The following Centreon objects:
| Parameter | Parameter type | Description |
|---|---|---|
| Host groups | Multi select | Select host group. |
| Service Categories | Multi select | Select service category. |
| Hosts Categories | Multi select | Select host categories. |
| Metrics | Multi select | Select metrics. If no metric is selected, graphs by metric will not be displayed. |
| Time period | Dropdown list | Specify whether you want to see all the metrics on one graph for each service, a graph by metric, or both. |
| Interval | Text field | Specify no. of months to show in trend graphs. |
| overloaded | number | Specify threshold determining resource is overloaded. Unit : see prerequisites. |
| underused | number | Specify threshold determining resource is underused. Unit : see prerequisites. |
Prerequisites
This report can be generated using indicators that return a maximum value or not.
- If the metric has a maximum value, the threshold must be filled with a percent value (between 0 and 100).
- If the metric does not have a maximum value (e.g., counter for visitors on a website), the thresholds must be expressed in the same unit as the indicator (the counter for visitors).
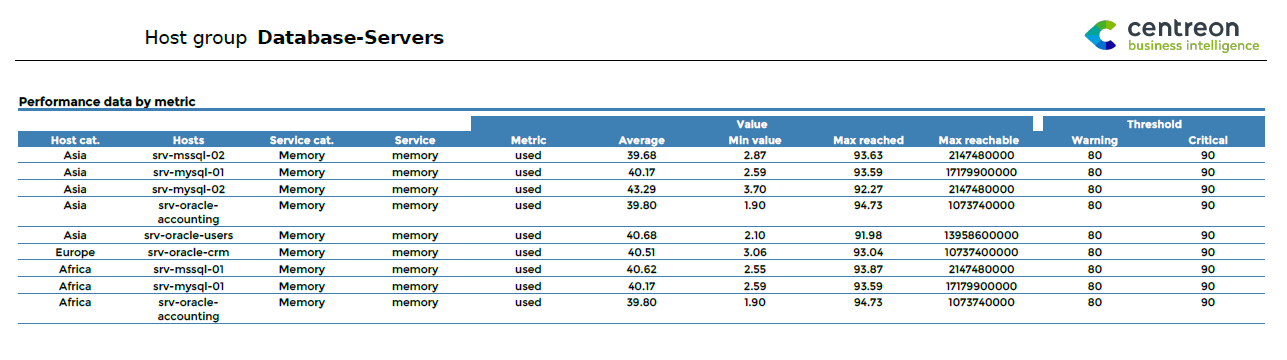
Hostgroup-Service-Metric-Performance-List
Description
This report displays the average performance data for a list of services. It also shows the minimum and maximum values reached over the time period, the maximum potential value, and warning and critical thresholds for all service metrics selected.
- If the maximum value is returned by the plugin, the Average, Max and Min columns are displayed in percentage (%). The calculation is: value / maximum value.
- If the maximum value not returned by the plugin, the Average, Max and Min columns are displayed in the metric's units.
Parameters
Parameters required for the report:
- Reporting period
- The following Centreon objects:
| Parameter | Parameter type | Description |
|---|---|---|
| Hostgroup | Drop-down list | Select host group. |
| Host Categories | Multi selection | Select host categories. |
| Service Categories | Multi selection | Select service categories. |
| Metrics | Multi select | Specify metric to INCLUDE. |
| Time period | Dropdown list | Specify time period. |
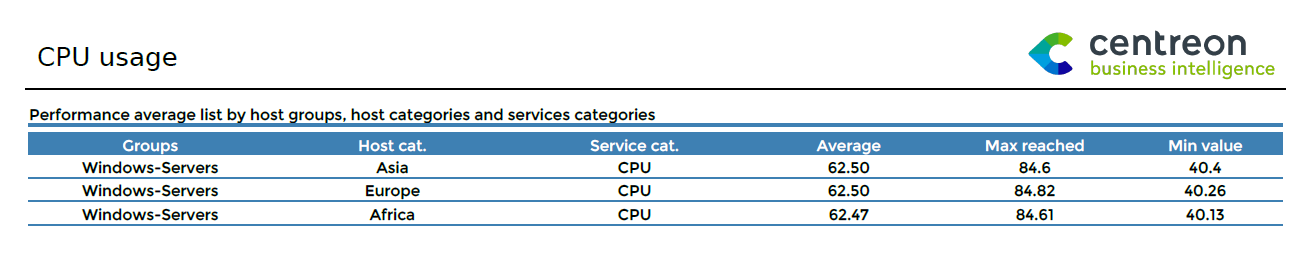
Hostgroups-Categories-Performance-List
Description
This report displays the average performance data for a list of host groups, host categories and service categories. It also shows the minimum and maximum value reached over the time period.
- If the maximum value is returned by the plugin, the Average, Max and Min columns are displayed in percentage (%). The calculation is: value / maximum value.
- If the maximum value is not returned by the plugin, the Average, Max and Min columns are displayed in the metric's units.
Parameters
Parameters required for the report:
- Reporting period
- The following Centreon objects:
| Parameter | Parameter type | Description |
|---|---|---|
| Hostgroups | Multi selection | Select host groups. |
| Host Categories | Multi selection | Select host categories. |
| Service Categories | Multi selection | Select service categories. |
| Metrics | Mutli select | Specify metric to INCLUDE. |
| Time period | Dropdown list | Specify time period. |