Introduction to MBI
What is Centreon MBI?
Centreon Monitoring Business Intelligence (MBI) is an extension that is used to generate reports on host groups, host categories and service categories. MBI requires users to prepare their data carefully so that reports can be generated. We highly recommend you read our documentation to avoid running into issues. You can start with our concepts page.
Centreon MBI is a Centreon extension that requires a valid license. To purchase one and retrieve the necessary repositories, contact Centreon.
What does MBI do?
Centreon MBI runs jobs to generate reports. MBI has more than 30 different ready-to-use templates (report "designs").
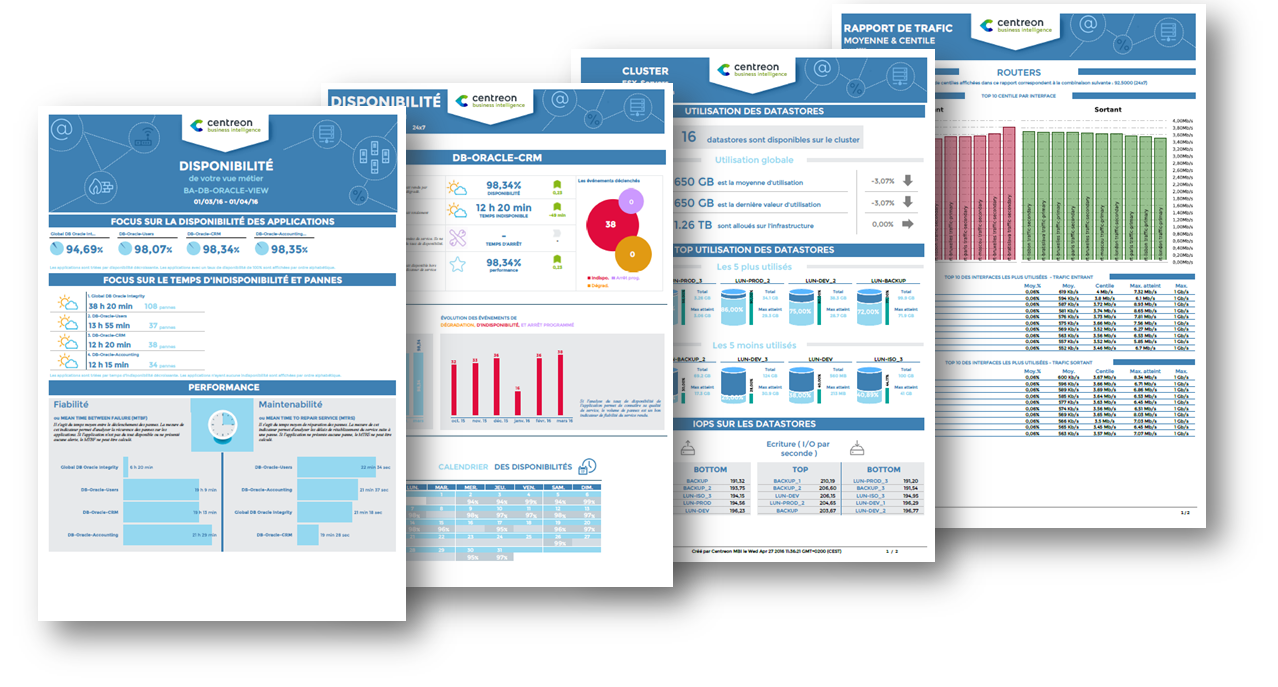
Reports address:
- Capacity planning and management
- Availability management
- SLA (Service Level Agreement) management
- Performance management.
This allows for an overview of the performance of the selected resources over a given period of time. These reports can be configured to be generated once or on a regular basis (i.e. once per day, week, month...). This will help you keep track of your IT environment with monthly uptime reports, weekly infrastructure performance summaries...
What kind of data can appear on the reports ?
Reports can display data about:
- Host groups
- Host categories
- Service categories
- Business views
- Business activities
Although data must be organized into groups and categories, some reports allow you to see the details of statuses and metrics for hosts and services.
MBI also creates reports on availability by converting checks into events. Note that MBI only takes into account HARD statuses when calculating availability.
Note that reports only contain data up to the previous day. The data for each day is aggregated by the ETL the following day.
What are the possible output formats?
- MBI generates reports in different formats: PDF, CSV, XLSX, DOCX, PPTX, ODT, ODS, ODP.
-
- Not all reports can be exported to every format. See our table of supported formats below.
- By default, these reports can be downloaded from the Reports view page, but they can also be configured to be sent to specific people when generated.
- Report data can also be displayed in your Centreon custom views using dedicated widgets.
Supported formats
| Category | Report | CSV* | XLSX | DOCX | PPTX | ODT | ODS | ODP | |
|---|---|---|---|---|---|---|---|---|---|
| Business activity monitoring | BV-BA-Availabilities-1 | BEST | Non-Ok | OK | OK | OK | OK | OK | OK |
| BA-Availability-1 | BEST | Non-Ok | OK | OK | OK | OK | OK | OK | |
| BV-BA-Availabilities-List | BEST | Non-Ok | OK | OK | OK | OK | OK | OK | |
| BA-Event-List | BEST | Non-Ok | OK | OK | OK | OK | OK | OK | |
| BV-BA-Current-Health-VS-Past | BEST | Non-Ok | OK | OK | OK | OK | OK | OK | |
| BV-BA-Availabilities-Calendars | BEST | Non-Ok | OK | OK | OK | OK | OK | OK | |
| Availability & Events | Hostgroups-Incidents-1 | BEST | Non-Ok | OK | OK | OK | OK | OK | OK |
| Hostgroups-Availability-1 | BEST | Non-Ok | OK | OK | OK | OK | OK | OK | |
| Hostgroup-Availability-2 | BEST | Non-Ok | OK | OK | OK | OK | OK | OK | |
| Hostgroup-Service-Incident-Resolution-2 | BEST | Non-Ok | OK | OK | OK | OK | OK | OK | |
| Hostgroup-Host-Availability-List | OK | Non-OK | BEST | OK | OK | OK | OK | OK | |
| Hostgroup-Host-Event-List | OK | Non-OK | BEST | OK | OK | OK | OK | OK | |
| Hostgroup-Service-Availability-List | OK | Non-OK | BEST | OK | OK | OK | OK | OK | |
| Hostgroup-Service-Event-List | OK | Non-OK | BEST | OK | OK | OK | OK | OK | |
| Hostgroup-Host-Pareto | BEST | Non-Ok | OK | OK | OK | OK | OK | OK | |
| Hostgroups-Host-Current-Events | BEST | Non-Ok | OK | OK | OK | OK | OK | OK | |
| Hostgroups-Service-Current-Events | BEST | Non-Ok | OK | OK | OK | OK | OK | OK | |
| Performance | Host-Graphs-V2 | BEST | Non-Ok | OK | OK | OK | OK | OK | OK |
| Hostgroup-Graphs-v2 | BEST | Non-Ok | OK | OK | OK | OK | OK | OK | |
| Hostgroup-Capacity-Planning-Linear-Regression | BEST | Non-Ok | OK | OK | OK | OK | OK | OK | |
| Hostgroups-Rationalization-Of-Resources-1 | BEST | Non-Ok | OK | OK | OK | OK | OK | OK | |
| Hostgroup-Service-Metric-Performance-List | OK | Non-OK | BEST | OK | OK | OK | OK | OK | |
| Hostgroups-Categories-Performance-List | OK | Non-OK | BEST | OK | OK | OK | OK | OK | |
| Storage | Hostgroups-Storage-Capacity-1 | BEST | Non-Ok | OK | OK | OK | OK | OK | OK |
| Hostgroup-Storage-Capacity-2 | BEST | Non-Ok | OK | OK | OK | OK | OK | OK | |
| Hostgroup-Storage-Capacity-List | OK | Non-OK | BEST | OK | OK | OK | OK | OK | |
| Network | Hostgroup-Traffic-By-Interface-And-Bandwith-Ranges | BEST | Non-Ok | OK | OK | OK | OK | OK | OK |
| Hostgroup-Traffic-average-By-Interface | BEST | Non-Ok | OK | OK | OK | OK | OK | OK | |
| Hostgroup-monthly-network-percentile | BEST | Non-Ok | OK | OK | OK | OK | OK | OK | |
| Virtualization | VMWare-Cluster-Performances-1 | BEST | Non-Ok | OK | OK | OK | OK | OK | OK |
| VMWare-VM-Performances-List | OK | Non-OK | BEST | OK | OK | OK | OK | OK | |
| Electric consumption | Hostgroup-Electricity-Consumption-1 | BEST | Non-Ok | OK | OK | OK | OK | OK | OK |
| Profiling | Host-Detail-2 | BEST | Non-Ok | OK | OK | OK | OK | OK | OK |
| Host-Detail-3 | BEST | Non-Ok | OK | OK | OK | OK | OK | OK | |
| Hostgroup-Host-Details-1 | BEST | Non-Ok | OK | OK | OK | OK | OK | OK | |
| Inventory & Configuration | Hostgroups-Host-Templates | OK | Non-OK | BEST | OK | OK | OK | OK | OK |
| Hostgroups-Service-Templates | OK | Non-OK | BEST | OK | OK | OK | OK | OK | |
| Poller-Performances | BEST | Non-Ok | OK | OK | OK | OK | OK | OK | |
| Hosts-not-classified | OK | Non-OK | BEST | OK | OK | OK | OK | OK | |
| Services-not-classified | OK | Non-OK | BEST | OK | OK | OK | OK | OK | |
| Database diagnostics | Content-diagnostic | OK | Non-OK | BEST | OK | OK | OK | OK | OK |
| Content-diagnostic-availability | OK | Non-OK | BEST | OK | OK | OK | OK | OK | |
| Content-diagnostic-performance | OK | Non-OK | BEST | OK | OK | OK | OK | OK | |
| Metric-integrity-check | OK | Non-OK | BEST | OK | OK | OK | OK | OK |
* The CSV format is only for custom reports.