Monitoring non-public user journeys
A private Synthetic Monitoring Zone (STM zone) allows you to monitor your user journeys on internal domains or networks specific to your organization. To do this, a probe must be deployed inside your infrastructure. You can also use a probe to obtain personalized recommendations to optimize your website. The probes are able to cache their results to cover for an eventual temporary network outage.
Prerequisites
- A machine inside your infrastructure to host the probe. The machine must be able to access the application you will monitor.
- A user journey configured on the internal application to monitor.
Step 1: Create a new STM zone
- From the Global View, open the site selector in the top-left corner and select your organization’s page.
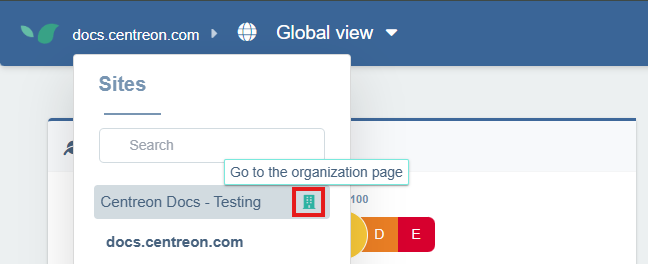
-
On your organization’s configuration page, click the Synthetic Monitoring Zones tab.
-
Click + New Synthetic Monitoring Zone. Give the zone a meaningful name (e.g., Paris Office) then click + Create.
Your new zone now appears in the list.
Step 2: Obtain a probe token
While remaining inside the organization page, open the Tokens tab. Click Create a token and follow the steps to create a probe token.
Save your token. You will need it to create the probe in the next step.
Step 3: Associate a probe to the STM zone
Click Associate a probe to the right of your zone. A window with multiple commands opens. Execute the Docker command to log in to the registry.
Step 4: Create and launch the probe
- STM probe
- Recommendations probe
STM probes collect the standard performance metrics that Experience Monitoring uses.
-
To create and launch the STM probe, execute the STM probe command you obtained at step 3 with the probe token.
-
Refresh the page: once launched, the probe is automatically saved and appears to the right of the associated zone in the Synthetic Monitoring Zones list.
Recommendation probes run once a day to make personalized suggestions on how to optimize your website.
-
To create and launch the recommendations probe, execute the recommendations probe command you obtained at step 3 with the probe token.
-
Refresh the page: once launched, the probe is automatically saved and appears to the right of the associated zone in the Synthetic Monitoring Zones list. Recommendation probes have a binoculars icon to distinguish them from STM probes.
Note that it takes up to 24 hours for the probe to gather enough data to start sending recommendations.
Step 5: Associate the zone with a user journey
-
Go to Configuration and select the User Journeys tab.
-
On the journey you want to run from your private zone, click on the three dots on the right, then click on Advanced.
-
In the Advanced configuration window, scroll down to the Synthetic Monitoring Zones section. Your private zone appears under Private Zones. Select it and click Save.
After a short while, the probe will run its first check and your internal journey monitoring will be operational. You can analyze it just like a regular user journey.
If you are running into any issues, try our user journey troubleshooting guide.