Creating dashboards
Dashboards are built using widgets. They allow you to display text, and charts that present the number of logs received according to specific parameters.
Creating a dashboard
-
To create a dashboard, in the Dashboards page, click Add.
-
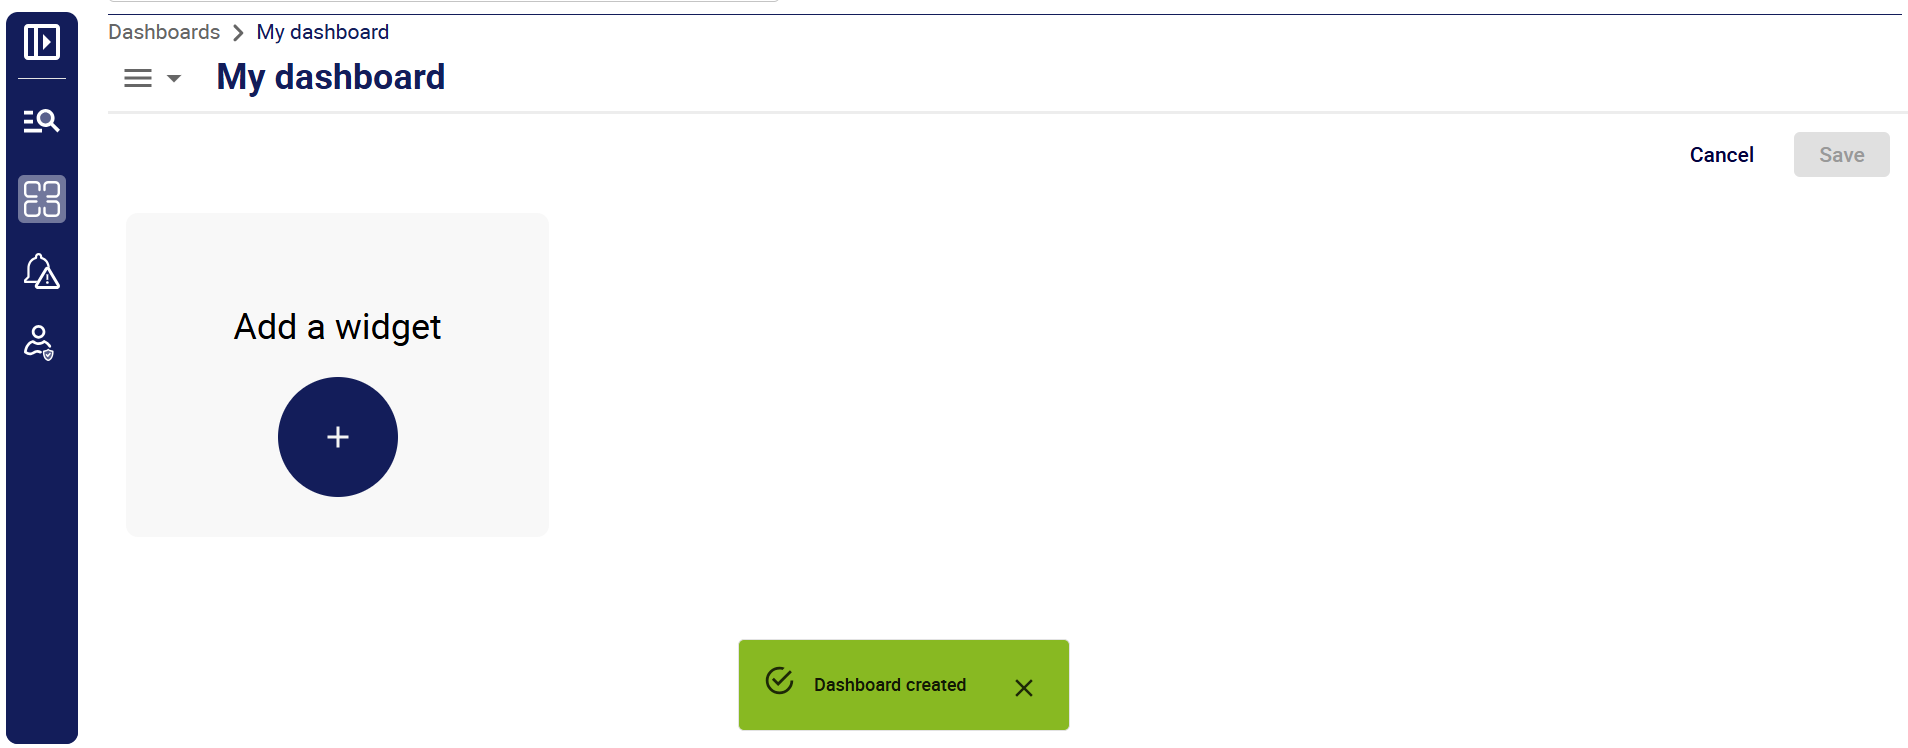
In the window that opens, enter a name (mandatory) and a description (optional), then click Create. A blank dashboard appears.
-
Add widgets to your dashboard.
-
Save each widget as you create or edit it, then save the dashboard itself. The dashboard appears in the list of dashboards.
Adding a widget to a dashboard
- If you are not already in your dashboard, edit it.
- In the dashboard, click Add a widget: the screen displays the widget creation screen.
- Select a widget type: the rest of the screen is updated to display the settings for this type of widget.
- Use the available settings to configure your widget.
- When you have finished configuring your widget, click Save in the bottom right corner. This only saves the widget: make sure you also save your dashboard before you do anything else.
Editing a dashboard
On the Dashboards page, click the name of the dashboard you want to edit. The dashboard opens; click Edit dashboard in the top-right corner to enter edit mode.
Edit each widget you want, saving your changes to each widget. Then save the dashboard itself.
Editing a widget
When editing a dashboard, click the 3 dots in the top rigt corner of a widget to enter edit mode. Once you have edited your widget, save it, then save th edashboard itself.
Available widgets
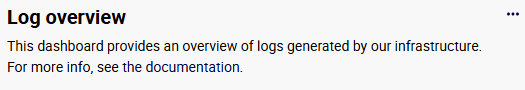
Generic text
Use this widget to insert titles, information or links into your dashboards. Use the toolbar to format the description.
Metrics graph
Here, "metrics" means the number of log entries that match a specific query, or the ratio obtained by dividing a query by another query. The resulting number of logs can be broken down according to another parameter. In the example below, each bar represents the number of INFO and ERROR logs for a service for a given period.

Select the settings you want in the left part of the screen.
- The type of widget (here, Metrics graph).
- A title and a description. These will be displayed in the widget at all times.
- Configure the aspect of the graph using the Display settings section.
- The time period you want the graph to cover.
Dataset selection
In the right part of the screen, define the data you want to display. The graph can display several data series. Each series is defined by a dataset. A dataset has the following parameters:
- Name: this will be the name of the data series in the legend of the graph.
-
Query: use the correct query syntax.
-
Operation:
- Count means that the query will return the number of log entries that match the query.
- Ratio means that you divide the results of a query by the results of another query.
If you display the graph in Line mode, each dataset will produce a curve. If you display the chart as a Bar chart, each dataset will produce a bar. Inside each bar, the data will be stacked according to the Group by parameter.