Develop with centreon-plugins
Set up your environment
To use the centreon-plugins framework, you'll need the following:
- A Linux operating system, Debian 11 or 12 or RHEL/RHEL-like >= 8
- The git command line utility
- A GitHub account.
Enable our plugins repository
This repository will provide you our packaged plugins as well as the dependencies that are not available in the standard distribution repositories.
- Alma / RHEL / Oracle Linux 8
- Alma / RHEL / Oracle Linux 9
- Debian 11 & 12
cat >/etc/yum.repos.d/centreon-plugins.repo <<'EOF'
[centreon-plugins-stable]
name=Centreon plugins repository.
baseurl=https://packages.centreon.com/rpm-plugins/el8/stable/$basearch/
enabled=1
gpgcheck=1
gpgkey=https://yum-gpg.centreon.com/RPM-GPG-KEY-CES
module_hotfixes=1

[centreon-plugins-stable-noarch]
name=Centreon plugins repository.
baseurl=https://packages.centreon.com/rpm-plugins/el8/stable/noarch/
enabled=1
gpgcheck=1
gpgkey=https://yum-gpg.centreon.com/RPM-GPG-KEY-CES
module_hotfixes=1

[centreon-plugins-testing]
name=Centreon plugins repository. (UNSUPPORTED)
baseurl=https://packages.centreon.com/rpm-plugins/el8/testing/$basearch/
enabled=0
gpgcheck=1
gpgkey=https://yum-gpg.centreon.com/RPM-GPG-KEY-CES
module_hotfixes=1

[centreon-plugins-testing-noarch]
name=Centreon plugins repository. (UNSUPPORTED)
baseurl=https://packages.centreon.com/rpm-plugins/el8/testing/noarch/
enabled=0
gpgcheck=1
gpgkey=https://yum-gpg.centreon.com/RPM-GPG-KEY-CES
module_hotfixes=1

[centreon-plugins-unstable]
name=Centreon plugins repository. (UNSUPPORTED)
baseurl=https://packages.centreon.com/rpm-plugins/el8/unstable/$basearch/
enabled=0
gpgcheck=1
gpgkey=https://yum-gpg.centreon.com/RPM-GPG-KEY-CES
module_hotfixes=1

[centreon-plugins-unstable-noarch]
name=Centreon plugins repository. (UNSUPPORTED)
baseurl=https://packages.centreon.com/rpm-plugins/el8/unstable/noarch/
enabled=0
gpgcheck=1
gpgkey=https://yum-gpg.centreon.com/RPM-GPG-KEY-CES
module_hotfixes=1
EOF
cat >/etc/yum.repos.d/centreon-plugins.repo <<'EOF'
[centreon-plugins-stable]
name=Centreon plugins repository.
baseurl=https://packages.centreon.com/rpm-plugins/el9/stable/$basearch/
enabled=1
gpgcheck=1
gpgkey=https://yum-gpg.centreon.com/RPM-GPG-KEY-CES
module_hotfixes=1

[centreon-plugins-stable-noarch]
name=Centreon plugins repository.
baseurl=https://packages.centreon.com/rpm-plugins/el9/stable/noarch/
enabled=1
gpgcheck=1
gpgkey=https://yum-gpg.centreon.com/RPM-GPG-KEY-CES
module_hotfixes=1

[centreon-plugins-testing]
name=Centreon plugins repository. (UNSUPPORTED)
baseurl=https://packages.centreon.com/rpm-plugins/el9/testing/$basearch/
enabled=0
gpgcheck=1
gpgkey=https://yum-gpg.centreon.com/RPM-GPG-KEY-CES
module_hotfixes=1

[centreon-plugins-testing-noarch]
name=Centreon plugins repository. (UNSUPPORTED)
baseurl=https://packages.centreon.com/rpm-plugins/el9/testing/noarch/
enabled=0
gpgcheck=1
gpgkey=https://yum-gpg.centreon.com/RPM-GPG-KEY-CES
module_hotfixes=1

[centreon-plugins-unstable]
name=Centreon plugins repository. (UNSUPPORTED)
baseurl=https://packages.centreon.com/rpm-plugins/el9/unstable/$basearch/
enabled=0
gpgcheck=1
gpgkey=https://yum-gpg.centreon.com/RPM-GPG-KEY-CES
module_hotfixes=1

[centreon-plugins-unstable-noarch]
name=Centreon plugins repository. (UNSUPPORTED)
baseurl=https://packages.centreon.com/rpm-plugins/el9/unstable/noarch/
enabled=0
gpgcheck=1
gpgkey=https://yum-gpg.centreon.com/RPM-GPG-KEY-CES
module_hotfixes=1
EOF
wget -O- https://apt-key.centreon.com | gpg --dearmor | tee /etc/apt/trusted.gpg.d/centreon.gpg > /dev/null 2>&1
echo "deb https://packages.centreon.com/apt-plugins-stable/ $(lsb_release -sc) main" | tee /etc/apt/sources.list.d/centreon-plugins.list
apt-get update
Install the following dependencies:
- Alma / RHEL / Oracle Linux 8
- Alma / RHEL / Oracle Linux 9
- Debian 11 & 12
dnf config-manager --set-enabled powertools
dnf install -y git 'perl(Digest::MD5)' 'perl(Pod::Find)' 'perl-Net-Curl' 'perl(URI::Encode)' \
    'perl(LWP::UserAgent)' 'perl(LWP::Protocol::https)' 'perl(IO::Socket::SSL)' 'perl(URI)' \
    'perl(HTTP::ProxyPAC)' 'perl-CryptX' 'perl(MIME::Base64)' 'perl(JSON::XS)' 'perl-JSON-Path' \
    'perl-KeePass-Reader' 'perl(Storable)' 'perl(POSIX)' 'perl(Encode)'
dnf config-manager --set-enabled crb
dnf install -y git 'perl(Digest::MD5)' 'perl(Pod::Find)' 'perl-Net-Curl' 'perl(URI::Encode)' \
    'perl(LWP::UserAgent)' 'perl(LWP::Protocol::https)' 'perl(IO::Socket::SSL)' 'perl(URI)' \
    'perl(HTTP::ProxyPAC)' 'perl-CryptX' 'perl(MIME::Base64)' 'perl(JSON::XS)' 'perl-JSON-Path' \
    'perl-KeePass-Reader' 'perl(Storable)' 'perl(POSIX)' 'perl(Encode)'
apt-get install -y git 'libpod-parser-perl' 'libnet-curl-perl' 'liburi-encode-perl' 'libwww-perl' \
    'liblwp-protocol-https-perl' 'libhttp-cookies-perl' 'libio-socket-ssl-perl' 'liburi-perl' \
    'libhttp-proxypac-perl' 'libcryptx-perl' 'libjson-xs-perl' 'libjson-path-perl' \
    'libcrypt-argon2-perl' 'libkeepass-reader-perl'
Fork and clone the centreon-plugins repository
Within GitHub UI, on the top left, click on the Fork button:
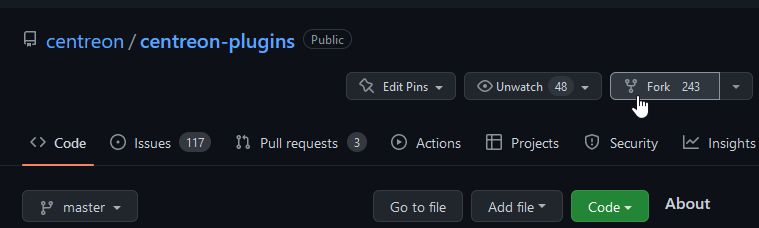
Use the git utility to fetch your repository fork:
git clone https://<githubusername>@github.com/<githubusername>/centreon-plugins
Create a branch:
cd centreon-plugins
git checkout -b 'my-first-plugin'
Understand project organization
Layout and concepts
The project content is made of a main binary (centreon_plugins.pl), and a logical
directory structure allowing to separate plugins and modes files across the domain they
are referring to.
You can display it using the command tree -L 1.
.
├── apps
├── blockchain
├── centreon
├── centreon_plugins.pl
├── changelog
├── cloud
├── contrib
├── database
├── doc
├── example
├── hardware
├── Jenkinsfile
├── LICENSE.txt
├── network
├── notification
├── os
├── README.md
├── snmp_standard
├── sonar-project.properties
└── storage
Let's take a deeper look at the layout of the directory containing modes to monitor Linux
systems through the command-line (tree os/linux/local/ -L 1).
os/linux/local/
├── custom      # Type: Directory. Contains code that can be used by several modes (e.g authentication, token management, ...).
│   └── cli.pm  # Type: File. *Custom mode* defining common methods
├── mode        # Type: Directory. Contains all **modes**.
[...]
│   └── cpu.pm  # Type: File. **Mode** containing the code to monitor the CPU
[...]
└── plugin.pm   # Type: File. **Plugin** definition.
Note the os/linux/local. The project offers other ways to monitor Linux, SNMP for example. To avoid mixing modes using different protocols in the same directory and face some naming collisions, we split them across several directories making it clear what protocol they rely on.
Now, let's see how these concepts combine to build a command line:
# <perl interpreter> <main_binary> --plugin=<perl_normalized_path_to_plugin_file> --mode=<mode_name>
perl centreon_plugins.pl --plugin=os::linux::local::plugin --mode=cpu
Shared directories
Some specific directories are not related to a domain (os, cloud...) and are used across all plugins.
The centreon directory
The centreon directory is specific, it contains:
- Project libraries/packages. This is all the code that will help you to develop faster by avoiding coding protocol-related things (SNMP, HTTPx, SSH...) or common things like options or cache management from scratch. You can read the perl modules if you're an experienced developer but there is very little chance that you would have to modify anything in it.
- Common files shared by multiple plugins. This is to avoid duplicating code across the directory tree and ease the maintenance of the project.
The snmp_standard/mode directory
The snmp_standard/mode exists since the beginning when SNMP monitoring was much more used than it is today. All the modes it contains use standard OIDs, which means that many plugins are relying on these when the manufacturer supports standard MIBs on their devices.
Tutorial - How to create a plugin for my-awesome-app
Context: simple JSON health API
In this tutorial, we will create a very simple probe checking an application's health displayed in JSON through a simple API.
You can mockup an API with the free mocky tool.
We created one for this tutorial, test it with curl https://run.mocky.io/v3/da8d5aa7-abb4-4a5f-a31c-6700dd34a656
It returns the following output:
{
    "health": "yellow",
    "db_queries":{
         "select": 1230,
         "update": 640,
         "delete": 44
    },
    "connections":[
      {
        "component": "my-awesome-frontend",
        "value": 122
      },
      {
        "component": "my-awesome-db",
        "value": 92
      }
    ],
    "errors":[
      {
        "component": "my-awesome-frontend",
        "value": 32
      },
      {
        "component": "my-awesome-db",
        "value": 27
      }
    ]
}
All files showed in this tutorial can be found on the centreon-plugins GitHub in the tutorial contrib section.
You have to move the contents of
contrib/tutorial/apps/toapps/if you want to run it for testing purposes.
cp -R contrib/tutorial/apps/* apps/
Understand the data
Understanding the data is very important as it will drive the way you will design the mode internals. This is the first thing to do, no matter what protocol you are using.
There are several important properties for a piece of data:
- Type of the data to process: string, int... There is no limitation in the kind of data you can process
- Dimensions of the data, is it global or linked to an instance?
- Data layout, in other words anticipate the kind of data structure to manipulate.
In our example, the most common things are present. We can summarize it like that:
- the
healthnode is global data and is a string. Structure is a simple key/value pair - the
db_queriesnode is a collection of global integer values about the database. Structure is a hash containing multiple key/value pairs - the
connectionsnode contains integer values (122,92) referring to specific instances (my-awesome-frontend,my-awesome-db). The structure is an array of hashes errorsis the same asconnectionsexcept the data itself tracks errors instead of connections.
Understanding this will be important to code it correctly.
Create directories for a new plugin
Create directories and files required for your plugin and modes.
Go to your centreon-plugins local git and create the appropriate directories and files:
# path to the main directory and the subdirectory containing modes
mkdir -p apps/myawesomeapp/api/mode/
# path to the main plugin file
touch apps/myawesomeapp/api/plugin.pm
# path to the specific mode(s) file(s)
touch apps/myawesomeapp/api/mode/appsmetrics.pm
Create the plugin.pm file
The plugin.pm is the first thing to create, it contains:
- A set of instructions to load required libraries and compilation options
- A list of all mode(s) and path(s) to their associated files/perl packages
- A description that will display when you list all plugins or display this plugin's help.
Here is the commented version of the plugin.pm file:
[.. license and copyright things ..]

# Name of your perl package
package apps::myawesomeapp::api::plugin;

# Always use strict and warnings, will guarantee that your code is clean and help debugging it
use strict;
use warnings;
# Load the base for your plugin, here we don't do SNMP, SQL or have a custom directory, so we use the _simple base
use base qw(centreon::plugins::script_simple);

# Global sub to create and return the perl object. Don't bother understand what each instruction is doing.
sub new {
    my ($class, %options) = @_;
    my $self = $class->SUPER::new(package => __PACKAGE__, %options);
    bless $self, $class;

    # A version, we don't really use it but could help if your want to version your code
    $self->{version} = '0.1';
    # Important part!
    #    On the left, the name of the mode as users will use it in their command line
    #    On the right, the path to the file (note that .pm is not present at the end)
    $self->{modes} = {
        'app-metrics' => 'apps::myawesomeapp::api::mode::appmetrics'
    };

    return $self;
}

# Declare this file as a perl module/package
1;

# Beginning of the documenation/help. `__END__` Specify to the interpreter that instructions below don't need to be compiled
# =head1 [..] Specify the section level and the label when using the plugin with --help
# Check my-awesome [..] Quick overview of wath the plugin is doing
# =cut Close the head1 section

__END__

=head1 PLUGIN DESCRIPTION

Check my-awesome-app health and metrics through its custom API

=cut
Your first dummy plugin is working, congrats!
Run this command:
perl centreon_plugins.pl --plugin=apps::myawesomeapp::api::plugin --list-mode
It already outputs a lot of things. Ellipsized lines are basically all standard capabilities inherited from the script_custom base.
You probably already recognized things you've previsously defined in your plugin.pm module.
Plugin Description:
    Check my-awesome-app health and metrics through its custom API

Global Options:
    --mode  Choose a mode.
[..]
    --version
            Display plugin version.
[..]

Modes Available:
   app-metrics
Create the appmetrics.pm file
The appmetrics.pm file will contain your code, in other words, all the instructions to:
- Declare options for the mode
- Connect to run.mocky.io over HTTPS
- Get the JSON from the /v3/da8d5aa7-abb4-4a5f-a31c-6700dd34a656 endpoint
- Extract information and format it to be compliant with Centreon.
Let's build it iteratively.
Important note: function (sub) names must not be modified. For example, you cannot choose to rename
check_optionstooption_check.
Common declarations and subs
# Path to your package. '::' instead of '/', and no .pm at the end.
package apps::myawesomeapp::api::mode::appmetrics;

# Don't forget these ;)
use strict;
use warnings;
# We want to connect to an HTTP server, let's use the common module
use centreon::plugins::http;
# Use the counter module. It will save you a lot of work and will manage a lot of things for you.
# Consider this as mandatory when writing a new mode.
use base qw(centreon::plugins::templates::counter);
# Import some functions that will make your life easier
use centreon::plugins::templates::catalog_functions qw(catalog_status_threshold_ng);
# We will have to process some JSON, no need to reinvent the wheel, load the lib you installed in a previous section
use JSON::XS;
Add a new function (sub) to initialize the mode:
sub new {
    my ($class, %options) = @_;
    # All options/properties of this mode, always add the force_new_perfdata => 1 to enable new metric/performance data naming.
    # It also where you can specify that the plugin uses a cache file for example
    my $self = $class->SUPER::new(package => __PACKAGE__, %options, force_new_perfdata => 1);
    bless $self, $class;

    # This is where you can specify options/arguments your plugin supports.
    # All options here stick to what the centreon::plugins::http module needs to establish a connection
    # You don't have to specify all options from the http module, only the one that the user may want to tweak for its needs
    $options{options}->add_options(arguments => {
        # One the left it's the option name that will be used in the command line. The ':s' at the end is to
        # define that this options takes a value.
        # On the right, it's the code name for this option, optionnaly you can define a default value so the user
        # doesn't have to set it
         'hostname:s'           => { name => 'hostname' },
         'proto:s'              => { name => 'proto', default => 'https' },
         'port:s'               => { name => 'port', default => 443 },
         'timeout:s'            => { name => 'timeout' },
        # These options are here to defined conditions about which status the plugin will return regarding HTTP response code
         'unknown-status:s'     => { name => 'unknown_status', default => '%\{http_code\} < 200 or %\{http_code\} >= 300' },
         'warning-status:s'     => { name => 'warning_status' },
         'critical-status:s'    => { name => 'critical_status', default => '' }
    });

    # This is to create a local copy of a centreon::plugins::http that we will manipulate
    # %options basically overwrite default http value with key/value pairs from options above to instantiate the http module
    # Ref https://github.com/centreon/centreon-plugins/blob/520a1f8c10cd434c6dedd1e342285eecff8b9d1b/centreon/plugins/http.pm#L59
    $self->{http} = centreon::plugins::http->new(%options);
    return $self;
}
Add a check_options function. This sub will execute right after new and allow you to check that the user passed
mandatory parameter(s) and in some case check that the format is correct.
sub check_options {
    my ($self, %options) = @_;
    $self->SUPER::check_options(%options);

    # Check if the user provided a value for --hostname option. If not, display a message and exit
    if (!defined($self->{option_results}-\{hostname\}) || $self->{option_results}-\{hostname\} eq '') {
        $self->{output}->add_option_msg(short_msg => 'Please set hostname option');
        $self->{output}->option_exit();
    }
    # Set parameters for http module, note that the $self->{option_results} is a hash containing
    # all your options key/value pairs.
    $self->{http}->set_options(%{$self->{option_results}});
}

1;
Nice work, you now have a mode that can be executed without errors!
Run this command perl centreon_plugins.pl --plugin=apps::myawesomeapp::api::plugin --mode=app-metrics, which
outputs this message:
UNKNOWN: Please set hostname option
Now let's do some monitoring thanks to centreon-plugins.
Declare your counters
This part essentially maps the data you want to get from the API with the internal counter mode structure.
Remember how we categorized the data in a previous section.
The $self->{maps_counters_type} data structure describes these data while the $self->{maps_counters}->{global} one defines
their properties like thresholds and how they will be displayed to the users.
sub set_counters {
    my ($self, %options) = @_;

    $self->{maps_counters_type} = [
        # health and queries are global metric, they don't refer to a specific instance.
        # In other words, you cannot get several values for health or queries
        # That's why the type is 0.
        { name => 'health', type => 0, cb_prefix_output => 'prefix_health_output' },
        { name => 'queries', type => 0, cb_prefix_output => 'prefix_queries_output' },
        # app_metrics groups connections and errors and each will receive value for both instances (my-awesome-frontend and my-awesome-db)
        # the type => 1 explicits that
        # as above, you can define a callback (cb) function to manage the output prefix. This function is called
        # each time a value is passed to the counter and can be shared across multiple counters.
        { name => 'app_metrics', type => 1, cb_prefix_output => 'prefix_app_output' }
    ];

    $self->{maps_counters}->{health} = [
        # This counter is specific because it deals with a string value
        {
            label => 'health',
            # All properties below (before et) are related to the catalog_status_ng catalog function imported at the top of our mode
            type => 2,
            # These properties allow you to define default thresholds for each status but not mandatory.
            warning_default => '%\{health\} =~ /yellow/',
            critical_default => '%\{health\} =~ /red/',
            # To simplify, manage things related to how get value in the counter, what to display and specific threshold
            # check because of the type of the data (string)
            set => {
                key_values => [ { name => 'health' } ],
                output_template => 'status: %s',
                # Force ignoring perfdata as the collected data is a string
                closure_custom_perfdata => sub { return 0; },
                closure_custom_threshold_check => \&catalog_status_threshold_ng
            }
        }
    ];
    $self->{maps_counters}->{queries} = [
        # The label defines options name, a --warning-select and --critical-select will be added to the mode
        # The nlabel is the name of your performance data / metric that will show up in your graph
        {
            label => 'select',
            nlabel => 'myawesomeapp.db.queries.select.count',
            set => {
            # Key value name is the name we will use to pass the data to this counter. You can have several ones.
                key_values => [ { name => 'select' } ],
                # Output template describe how the value will display
                output_template => 'select: %s',
                # Perfdata array allow you to define relevant metrics properties (min, max) and its sprintf template format
                perfdatas => [
                    { template => '%d', min => 0 }
                ]
            }
        },
        { label => 'update', nlabel => 'myawesomeapp.db.queries.update.count', set => {
                key_values => [ { name => 'update' } ],
                output_template => 'update: %s',
                perfdatas => [
                    { template => '%d', min => 0 }
                ]
            }
        },
        { label => 'delete', nlabel => 'myawesomeapp.db.queries.delete.count', set => {
                key_values => [ { name => 'delete' } ],
                output_template => 'delete: %s',
                perfdatas => [
                    { template => '%d', min => 0 }
                ]
            }
        }
    ];
    $self->{maps_counters}->{app_metrics} = [
        # The app_metrics has two different labels, connection and errors.
        { label => 'connections', nlabel => 'myawesomeapp.connections.count', set => {
                # pay attention the extra display key_value. It will receive the instance value. (my-awesome-db, my-awesome-frontend).
                # the display key_value isn't mandatory but we show it here for education purpose
                key_values => [ { name => 'connections' }, { name => 'display' } ],
                output_template => 'connections: %s',
                perfdatas => [
                    # we add the label_extra_instance option to have one perfdata per instance
                    { template => '%d', min => 0, label_extra_instance => 1 }
                ]
            }
        },
        { label => 'errors', nlabel => 'myawesomeapp.errors.count', set => {
                key_values => [ { name => 'errors' }, { name => 'display' } ],
                output_template => 'errors: %s',
                perfdatas => [
                    { template => '%d', min => 0, label_extra_instance => 1 }
                ]
            }
        }
    ];
}

# This should always be present at the end of the script.
1;
Remember to always move the final
1;instruction at the end of the script when you add new lines during this tutorial.
The mode compiles. Run the command
supplying a value to the --hostname option to see what it displays:
perl centreon_plugins.pl --plugin=apps::myawesomeapp::api::plugin --mode=app-metrics --hostname=fakehost
OK: status : skipped (no value(s)) - select : skipped (no value(s)), update : skipped (no value(s)), delete : skipped (no value(s))
You can see some of your counters with the skipped (no value(s)), it's normal, this is because we
just created the counters definition and structure but didn't push any values into it.
Create prefix callback functions
These functions are not mandatory but help to make the output more readable for a human. We will create it now but as you have noticed the mode compiles so you can choose to keep those for the polishing moment.
During counters definitions, we associated a callback function to each of them:
cb_prefix_output => 'prefix_health_output'cb_prefix_output => 'prefix_queries_output'cb_prefix_output => 'prefix_app_output'
Define those functions by adding it to our appmetrics.pm file. They are self-explanatory.
sub prefix_health_output {
    my ($self, %options) = @_;

    return 'My-awesome-app:';
}

sub prefix_queries_output {
    my ($self, %options) = @_;

    return 'Queries:';
}

sub prefix_app_output {
    my ($self, %options) = @_;

    # This notation allows you to return the value of the instance (the display key_value)
    # to bring some context to the output.
    return "'" . $options{instance_value}->{display} . "' ";
}

1;
Execute your command and check that the output matches the one below:
perl centreon_plugins.pl --plugin=apps::myawesomeapp::api::plugin --mode=app-metrics --hostname=fakehost
OK: My-awesome-app: status : skipped (no value(s)) - Queries: select : skipped (no value(s)), update : skipped (no value(s)), delete : skipped (no value(s))
The output is easier to read and separators are visible between global counters.
Get raw data from API and understand the data structure
It's the moment to write the main sub (manage_selection) - the most complex, but also the one that
will transform your mode to something useful and alive.
Think about the logic, what we have to do is:
- Connect to run.mocky.io over HTTPS
- Query a specific path corresponding to our API
- Store and process the result
- Spread this result across counters definitions
Start by writing the code to connect to run.mocky.io. It is where the centreon-plugins framework delivers its power.
All print instructions are available as commented code in the GitHub tutorial resources.
Write the request and add a print to display the received data:
sub manage_selection {
    my ($self, %options) = @_;
    # We have already loaded all things required for the http module
    # Use the request method from the module to run the GET request against the path
    my ($content) = $self->{http}->request(url_path => '/v3/da8d5aa7-abb4-4a5f-a31c-6700dd34a656');
    print $content . "\n";
}

1;
Run this command perl centreon_plugins.pl --plugin=apps::myawesomeapp::api::plugin --mode=app-metrics --hostname=run.mocky.io.
The output should be:
{
    "health": "yellow",
    "db_queries":{
         "select": 1230,
         "update": 640,
         "delete": 44
    },
    "connections":[
      {
        "component": "my-awesome-frontend",
        "value": 122
      },
      {
        "component": "my-awesome-db",
        "value": 92
      }
    ],
    "errors":[
      {
        "component": "my-awesome-frontend",
        "value": 32
      },
      {
        "component": "my-awesome-db",
        "value": 27
      }
    ]
}
OK: My-awesome-app: status : skipped (no value(s)) - Queries: select : skipped (no value(s)), update : skipped (no value(s)), delete : skipped (no value(s))
Add an eval structure to transform $content into a data structure that can be easily manipulated with perl. Let's
introduce the standard Data::Dumper library that can help understanding your data structures.
We load the Data::Dumper library and use one of its methods to print the JSON. A second line is here to print a simple message and get you familiar with how to access data within perl data structures.
sub manage_selection {
    my ($self, %options) = @_;
    # We have already loaded all things required for the http module
    # Use the request method from the imported module to run the GET request against the URL path of our API
    my ($content) = $self->{http}->request(url_path => '/v3/da8d5aa7-abb4-4a5f-a31c-6700dd34a656');

    # Declare a scalar deserialize the JSON content string into a perl data structure
    my $decoded_content;
    eval {
        $decoded_content = JSON::XS->new->decode($content);
    };
    # Catch the error that may arise in case the data received is not JSON
    if ($@) {
        $self->{output}->add_option_msg(short_msg => "Cannot encode JSON result");
        $self->{output}->option_exit();
    }
    use Data::Dumper;
    print Dumper($decoded_content);
    print "My App health is '" . $decoded_content->{health} . "'\n";
}

1;
Run the command perl centreon_plugins.pl --plugin=apps::myawesomeapp::api::plugin --mode=app-metrics --hostname=run.mocky.io
again and see how it changed.
You now have your JSON deserialized into a perl $VAR1 which represents your $decoded_content structure.
You can also note the result of the latest print and how we accessed the yellow value.
$VAR1 = {
          'connections' => [
                             {
                               'component' => 'my-awesome-frontend',
                               'value' => 122
                             },
                             {
                               'value' => 92,
                               'component' => 'my-awesome-db'
                             }
                           ],
          'health' => 'yellow',
          'errors' => [
                        {
                          'value' => 32,
                          'component' => 'my-awesome-frontend'
                        },
                        {
                          'value' => 27,
                          'component' => 'my-awesome-db'
                        }
                      ],
          'db_queries' => {
                            'select' => 1230,
                            'update' => 640,
                            'delete' => 44
                          }
        };
My App health is 'yellow'
Push data to global counters (type => 0)
Now that we know our data structure and how to access the values, we have to assign this
value to the counters we initially defined. Pay attention to the comments above
the $self->{health} and $self->{db_queries} assignations.
sub manage_selection {
    my ($self, %options) = @_;
    # We have already loaded all things required for the http module
    # Use the request method from the imported module to run the GET request against the URL path of our API
    my ($content) = $self->{http}->request(url_path => '/v3/da8d5aa7-abb4-4a5f-a31c-6700dd34a656');
    # Uncomment the line below when you reached this part of the tutorial.
    # print $content;

    # Declare a scalar deserialize the JSON content string into a perl data structure
    my $decoded_content;
    eval {
        $decoded_content = JSON::XS->new->decode($content);
    };
    # Catch the error that may arise in case the data received is not JSON
    if ($@) {
        $self->{output}->add_option_msg(short_msg => "Cannot encode JSON result");
        $self->{output}->option_exit();
    }
    # Uncomment the lines below when you reached this part of the tutorial.
    # use Data::Dumper;
    # print Dumper($decoded_content);
    # print "My App health is '" . $decoded_content->{health} . "'\n";

    # Here is where the counter magic happens.

    # $self->{health} is your counter definition (see $self->{maps_counters}->{<name>})
    # Here, we map the obtained string $decoded_content->{health} with the health key_value in the counter.
    $self->{health} = {
        health => $decoded_content->{health}
    };

    # $self->{queries} is your counter definition (see $self->{maps_counters}->{<name>})
    # Here, we map the obtained values from the db_queries nodes with the key_value defined in the counter.
    $self->{queries} = {
        select => $decoded_content->{db_queries}->{select},
        update => $decoded_content->{db_queries}->{update},
        delete => $decoded_content->{db_queries}->{delete}
    };

}

1;
Let's run our command again: no more skipped (no value(s)) message. You even get a
WARNING state because of the yellow app state.
perl centreon_plugins.pl --plugin=apps::myawesomeapp::api::plugin --mode=app-metrics --hostname=run.mocky.io
WARNING: My-awesome-app status: yellow | 'myawesomeapp.db.queries.select.count'=1230;;;0; 'myawesomeapp.db.queries.update.count'=640;;;0; 'myawesomeapp.db.queries.delete.count'=44;;;0;
Performance data confirm that values for database queries are correctly set as well.
This is how the counters mode template work (use base qw(centreon::plugins::templates::counter);), the only thing you have
to do is getting the data from the thing you have to monitor and push it to a counter definition.
Behind the scenes, it manages a lot of things for you:
- Options:
--warning-health --warning-select --warning-update --warning-delete and --critical-have automatically been defined - Performance data: thanks to
nlabeland values fromperfdatas:[]array in your counters - Display: It writes the status and substitutes values with the one assigned to the counter
Now, you probably understand better why the preparation work about understanding collected data and the counter definition part is essential: simply because it's the bigger part of the job.
Push data to counters having an instance (type => 1)
Now let's deal with counters with instances. That means that the same counters will receive multiple data, each of these data refering to a specific dimension.
They require to be manipulated in a slightly different way as we will have to specify the name we want to associate with the data.
First, we have to loop over both connections and errors arrays to access the app name and
measured value and then spread it within counters.
sub manage_selection {
    my ($self, %options) = @_;
    # We have already loaded all things required for the http module
    # Use the request method from the imported module to run the GET request against the URL path of our API
    my ($content) = $self->{http}->request(url_path => '/v3/da8d5aa7-abb4-4a5f-a31c-6700dd34a656');
    # Uncomment the line below when you reached this part of the tutorial.
    # print $content;

    # Declare a scalar deserialize the JSON content string into a perl data structure
    my $decoded_content;
    eval {
        $decoded_content = JSON::XS->new->decode($content);
    };
    # Catch the error that may arise in case the data received is not JSON
    if ($@) {
        $self->{output}->add_option_msg(short_msg => "Cannot encode JSON result");
        $self->{output}->option_exit();
    }
    # Uncomment the lines below when you reached this part of the tutorial.
    # use Data::Dumper;
    # print Dumper($decoded_content);
    # print "My App health is '" . $decoded_content->{health} . "'\n";

    # Here is where the counter magic happens.

    # $self->{health} is your counter definition (see $self->{maps_counters}->{<name>})
    # Here, we map the obtained string $decoded_content->{health} with the health key_value in the counter.
    $self->{health} = {
        health => $decoded_content->{health}
    };

    # $self->{queries} is your counter definition (see $self->{maps_counters}->{<name>})
    # Here, we map the obtained values from the db_queries nodes with the key_value defined in the counter.
    $self->{queries} = {
        select => $decoded_content->{db_queries}->{select},
        update => $decoded_content->{db_queries}->{update},
        delete => $decoded_content->{db_queries}->{delete}
    };

    # Initialize an empty app_metrics counter.
    $self->{app_metrics} = {};
    # Loop in the connections array of hashes
    foreach my $entry (@\{ $decoded_content->{connections\} }) {
        # Same logic than type => 0 counters but an extra key $entry->{component} to associate the value
        # with a specific instance
        $self->{app_metrics}->{ $entry->{component} }->{display} = $entry->{component};
        $self->{app_metrics}->{ $entry->{component} }->{connections} = $entry->{value};
    };

    # Exactly the same thing with errors
    foreach my $entry (@\{ $decoded_content->{errors\} }) {
        # Don't need to redefine the display key, just assign a value to the error key_value while
        # keeping the $entry->{component} key to associate the value with the good instance
        $self->{app_metrics}->{ $entry->{component} }->{errors} = $entry->{value};
    };

}

1;
Your app-metrics mode is (almost) complete. Once again, the counters template managed a lot
behind the scenes.
Execute this command to see how it evolved since the last execution. We modify the command with some additional parameters:
--warning-health='%{health} eq "care"'to avoid getting a WARNING, put any value that will not match yellow. Providing it as a parameter will automatically override the hardcoded default code value--verbosewill display the long output and the details for eachtype => 1counters
perl centreon_plugins.pl --plugin=apps::myawesomeapp::api::plugin --mode=app-metrics --hostname=run.mocky.io --warning-health='%{health} eq "care"' --verbose
Here is the expected output:
OK: My-awesome-app status: yellow - Queries: select: 1230, update: 640, delete: 44 | 'myawesomeapp.db.queries.select.count'=1230;;;0; 'myawesomeapp.db.queries.update.count'=640;;;0; 'myawesomeapp.db.queries.delete.count'=44;;;0; 'my-awesome-db#myawesomeapp.connections.count'=92;;;0; 'my-awesome-db#myawesomeapp.errors.count'=27;;;0; 'my-awesome-frontend#myawesomeapp.connections.count'=122;;;0; 'my-awesome-frontend#myawesomeapp.errors.count'=32;;;0;
'my-awesome-db' connections: 92, errors: 27
'my-awesome-frontend' connections: 122, errors: 32
You now get metrics displayed for both components 'my-awesome-db' and 'my-awesome-frontend' and also performance data
for your graphs. Note how the counter template automatically added the instance dimension on the left of the nlabel defined
for each counters: **my-awesome-frontend#**myawesomeapp.errors.count'=32;;;0;
Help section and assistant to build your centreon objects
Last but not least, you need to write a help section to explain users what your mode is doing and what options they can use.
The centreon-plugins framework has a built-in assistant to help you with the list of counters and options.
Run this command to obtain a summary that will simplify the work of creating Centreon commands and write the mode's help:
perl centreon_plugins.pl --plugin=apps::myawesomeapp::api::plugin --mode=app-metrics --hostname='anyvalue' --list-coun
ters --verbose
Get information from its output (shown below) to start building your mode's help:
counter list: select update delete health connections errors
configuration:  --warning-select='$_SERVICEWARNINGSELECT$' --critical-select='$_SERVICECRITICALSELECT$' --warning-update='$_SERVICEWARNINGUPDATE$' --critical-update='$_SERVICECRITICALUPDATE$' --warning-delete='$_SERVICEWARNINGDELETE$' --critical-delete='$_SERVICECRITICALDELETE$' --warning-health='$_SERVICEWARNINGHEALTH$' --critical-health='$_SERVICECRITICALHEALTH$' --warning-connections='$_SERVICEWARNINGCONNECTIONS$' --critical-connections='$_SERVICECRITICALCONNECTIONS$' --warning-errors='$_SERVICEWARNINGERRORS$' --critical-errors='$_SERVICECRITICALERRORS$'
Here is how you can write the help, note that this time you will add the content after the 1; and add the same
__END__ instruction like you did in the plugin.pm file.
__END__

=head1 MODE

Check my-awesome-app metrics exposed through its API

=over 8

=item B<--warning/critical-health>

Warning and critical threshold for application health string.

Defaults values are: --warning-health='%\{health\} eq "yellow"' --critical-health='%\{health\} eq "red"'

=item B<--warning/critical-select>

Warning and critical threshold for select queries

=item B<--warning/critical-update>

Warning and critical threshold for update queries

=item B<--warning/critical-delete>

Warning and critical threshold for delete queries

=item B<--warning/critical-connections>

Warning and critical threshold for connections

=item B<--warning/critical-errors>

Warning and critical threshold for errors

=back
You're done! You can enjoy a complete plugin and mode and the help now displays in a specific mode section:
perl centreon_plugins.pl --plugin=apps::myawesomeapp::api::plugin --mode=app-metrics --help
[..
   All global options from the centreon-plugins framework that your plugin benefits from
..]
Mode:
    Check my-awesome-app metrics exposed through its API

    --warning/critical-health
            Warning and critical threshold for application health string.

            Defaults are: --warning-health='%\{health\} eq "yellow"' &
            --critical-health='%\{health\} eq "red"'

    --warning/critical-select
            Warning and critical threshold for select queries

    --warning/critical-update
            Warning and critical threshold for update queries

    --warning/critical-delete
            Warning and critical threshold for delete queries

    --warning/critical-connections
            Warning and critical threshold for connections

    --warning/critical-errors
            Warning and critical threshold for errors