Collect OpenMetrics
There is an effort to promote Prometheus exposition format into a standard known as OpenMetrics. Some products adopted the format: InfluxData's suite, InfluxDB and Google Cloud Platform.
Installation
- Online License
- Offline License
-
Install the plugin on every poller expected to monitor openmetrics:
yum install centreon-plugin-Applications-Monitoring-Openmetrics -
Install the "OpenMetrics" Centreon Monitoring Connector from the Configuration > Connectors > Monitoring Connectors page.
-
Install the plugin on every poller expected to monitor openmetrics:
yum install centreon-plugin-Applications-Monitoring-Openmetrics -
Install the Centreon Monitoring Connector RPM on your Central server:
yum install centreon-pack-applications-monitoring-openmetrics -
Install the "OpenMetrics" Centreon Monitoring Connector from the Configuration > Connectors > Monitoring Connectors page.
Configuration
The Monitoring Connector "OpenMetrics" provide the collect of openmetrics from file on the collector (the template will be App-Monitoring-Openmetrics-File-custom) or from a API providing openmetrics (the template will be App-Monitoring-Openmetrics-Web-custom). Following the template, several macros must be configured :
App-Monitoring-Openmetrics-File-custom
| Mandatory | Name | Description |
|---|---|---|
| X | OPENMETRICSFILEPATH | Path of the file that containts openmetrics (eg. /var/data/metrics) |
| OPENMETRICSEXTRAOPTIONS | Any extraoptions you may want to add to every command line (eg. a --verbose flag) |
App-Monitoring-Openmetrics-Web-custom
| Mandatory | Name | Description |
|---|---|---|
| X | OPENMETRICSPORT | Port use by the endpoint (eg '80', '443' or '9000') |
| X | OPENMETRICSPROTO | Protocol use by the endpoint ('http' or 'https') |
| X | OPENMETRICSURLPATH | Path of the url that expose openmetrics (eg. /metrics) |
| OPENMETRICSUSERNAME | Username in case of authentication required | |
| OPENMETRICSPASSWORD | Password in case of authentication required | |
| OPENMETRICSEXTRAOPTIONS | Any extraoptions you may want to add to every command line (eg. a --verbose flag) |
Thoses 2 host templates will deploy automatically a service "Scrape-Metrics" bind to your host. This service can be duplicated as often as necessary according to the number of metrics to collect.
How To
Collect metrics using the command line
We have a server/container Prometheus which expose metrics ? Or a server/container Cadvisor which also expose metrics ? We are going to see some examples to collect thoses metrics from thoses endpoints.
Prometheus
Our server/container Prometheus expose metrics from this url:
<http://prometheus.int.centreon.com:9090/metrics>
# HELP prometheus_http_requests_total Counter of HTTP requests.
# TYPE prometheus_http_requests_total counter
prometheus_http_requests_total{code="200",handler="/alerts"} 1
prometheus_http_requests_total{code="200",handler="/api/v1/label/:name/values"} 24
prometheus_http_requests_total{code="200",handler="/api/v1/labels"} 3
prometheus_http_requests_total{code="200",handler="/api/v1/query"} 5454
prometheus_http_requests_total{code="200",handler="/api/v1/query_range"} 3390
prometheus_http_requests_total{code="200",handler="/api/v1/targets"} 3
prometheus_http_requests_total{code="200",handler="/config"} 2
prometheus_http_requests_total{code="200",handler="/flags"} 2
prometheus_http_requests_total{code="200",handler="/graph"} 17
prometheus_http_requests_total{code="200",handler="/metrics"} 155749
prometheus_http_requests_total{code="200",handler="/new/*filepath"} 6
prometheus_http_requests_total{code="200",handler="/service-discovery"} 2
prometheus_http_requests_total{code="200",handler="/static/*filepath"} 54
prometheus_http_requests_total{code="200",handler="/status"} 5
prometheus_http_requests_total{code="200",handler="/targets"} 11
prometheus_http_requests_total{code="302",handler="/"} 20
prometheus_http_requests_total{code="400",handler="/api/v1/query"} 1
prometheus_http_requests_total{code="400",handler="/api/v1/query_range"} 4
We would like here get the number of total requests on handler '/api/v1/query_range', first we are going to collect all the mertics named "prometheus_http_requests_total":
/usr/lib/centreon/plugins/centreon_monitoring_openmetrics.pl \
 --plugin apps::monitoring::openmetrics::plugin \
 --custommode web \
 --mode scrape-metrics \
 --hostname='prometheus.int.centreon.com' \
 --port='9090' \
 --proto='http' \
 --urlpath='/metrics' \
 --filter-metrics='prometheus_http_requests_total'
Command then returns:
OK: All metrics are ok | 'prometheus_http_requests_total'=1;;;; 'prometheus_http_requests_total'=24;;;; 'prometheus_http_requests_total'=3;;;; 'prometheus_http_requests_total'=5454;;;; 'prometheus_http_requests_total'=3390;;;; 'prometheus_http_requests_total'=3;;;; 'prometheus_http_requests_total'=2;;;; 'prometheus_http_requests_total'=2;;;; 'prometheus_http_requests_total'=17;;;; 'prometheus_http_requests_total'=155790;;;; 'prometheus_http_requests_total'=6;;;; 'prometheus_http_requests_total'=2;;;; 'prometheus_http_requests_total'=54;;;; 'prometheus_http_requests_total'=5;;;; 'prometheus_http_requests_total'=11;;;; 'prometheus_http_requests_total'=20;;;; 'prometheus_http_requests_total'=1;;;; 'prometheus_http_requests_total'=4;;;;
We used the options: custommode web (--custommode web) to request the API
prometheus using HTTP or HTTPS. Then we configured all the informations about
the connections: the hostname (--hostname='prometheus.int.centreon/com'), the
port (--port='9090'), the protocol (--proto='http') and the path of the URL
where the metrics are accessible (--urlpath='/metrics'). Then we fetched only
the metrics 'prometheus_http_requests_totol'
(--filter-metrics='prometheus_http_requests_total').
Now we would like filter the requests on URL '/api/v1/query_range', we are
going to use the option --instance to have the possibility to filter on a
field and then use the option --filter-instance to filter on the value of this
fields:
/usr/lib/centreon/plugins/centreon_monitoring_openmetrics.pl \
 --plugin apps::monitoring::openmetrics::plugin \
 --custommode web \
 --mode scrape-metrics \
 --hostname='prometheus.int.centreon.com' \
 --port='9090' \
 --proto='http' \
 --urlpath='/metrics' \
 --filter-metrics='prometheus_http_requests_total' \
 --instance='handler' \
 --filter-instance='/api/v1/query_range'
Command then returns:
OK: All metrics are ok | '/api/v1/query_range#prometheus_http_requests_total'=3390;;;; '/api/v1/query_range#prometheus_http_requests_total'=4;;;;
We filtered on the 'handlers' (--instance='hanlder') and so we only get the
metrics where the handler is '/api/v1/query_range'
(--filter-instance='/api/v1/query_range').
And now to finish, we are going to filter the requests that return a '200' as the code. And we want to have the possibility to get a graph in Centreon and alerting.
/usr/lib/centreon/plugins/centreon_monitoring_openmetrics.pl \
 --plugin apps::monitoring::openmetrics::plugin \
 --custommode web \
 --mode scrape-metrics \
 --hostname='prometheus.int.centreon.com' \
 --port='9090' \
 --proto='http' \
 --urlpath='/metrics' \
 --filter-metrics='prometheus_http_requests_total' \
 --instance='handler' \
 --filter-instance='/api/v1/query_range' \
 --subinstance='code' \
 --filter-subinstance='200' \
 --warning='5000' \
 --critical='10000'
Command then returns:
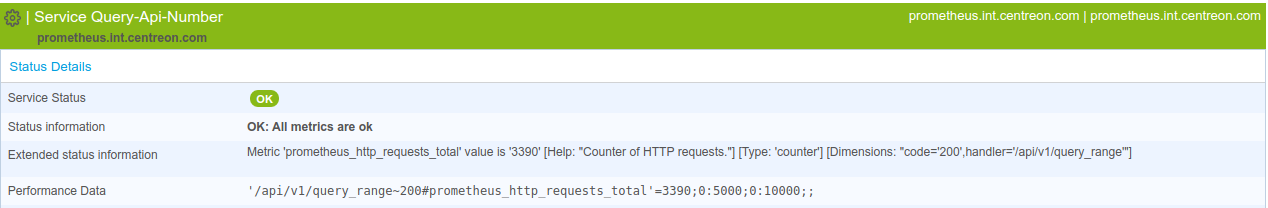
OK: All metrics are ok | '/api/v1/query_range~200#prometheus_http_requests_total'=3390;;;;
Here, we added the option --subinstance='code' to have a second filter on the
code value, and we filtered on the '200' code value with the opiton
--filter-subinstance='200'. For the thresholds, the options --warning='5000' --critical='10000' are set to trigger a WARNING alert if the metric's value is
granter than 5000 and a CRITICAL alert if the value is granter than 10000.
All the options of the different modes can be display using the help (--help)
Add the metrics to our monitoring
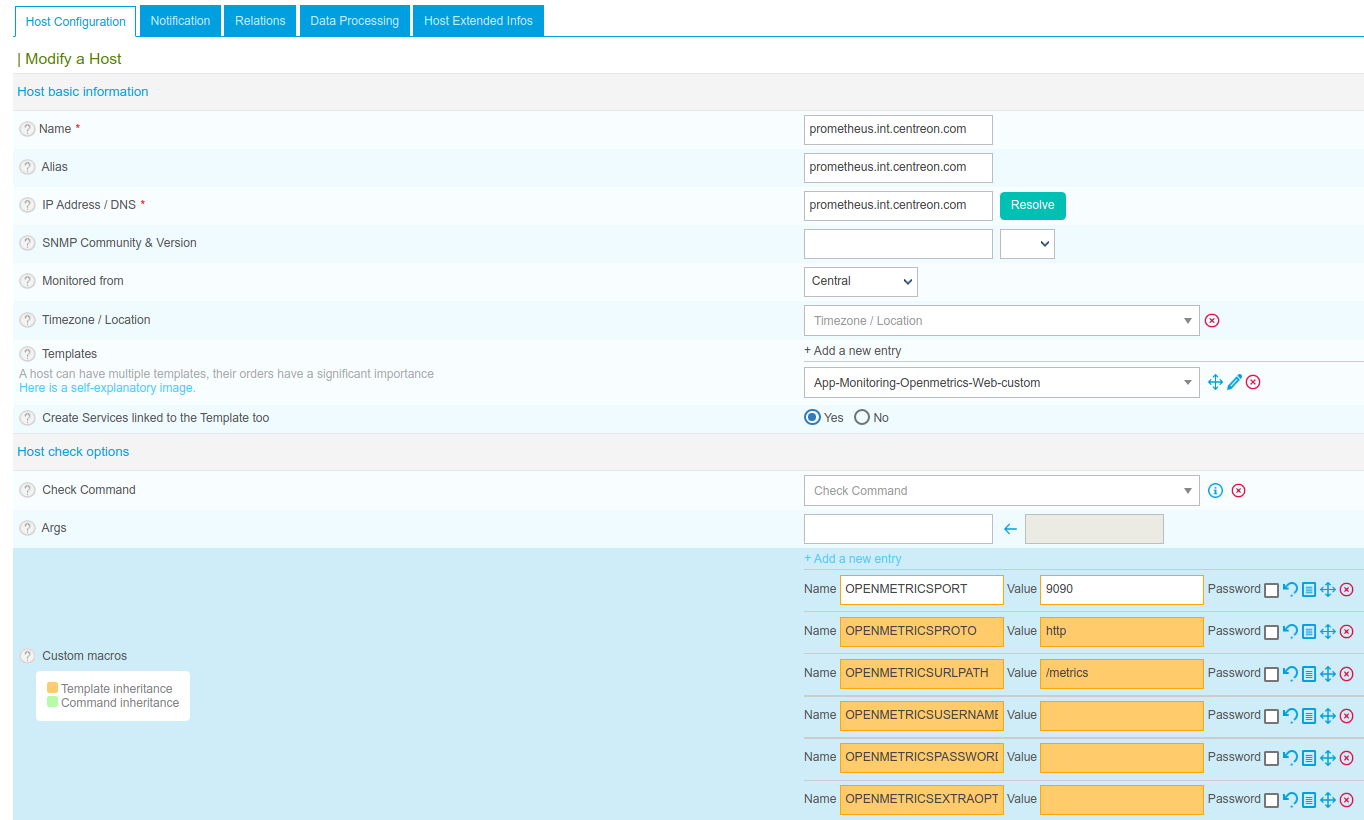
We are going to configure the host Prometheus by using the following parameters :
| Parameter | Value |
|---|---|
| NAME | prometheus.int.centreon.com |
| ALIAS | internal prometheus |
| IPADDRESS/FQDN | prometheus.int.centreon.com |
| TEMPLATE | App-Monitoring-Openmetrics-Web-custom |
| OPENMETRICSPORT | 80 |
| OPENMETRICSPROTO | http |
| OPENMETRICSURLPATH | /metrics |
We can edit the service "Scrape-Metrics" which have been created automatically by using the template "App-Monitoring-Openmetrics-Web-custom" to configure the macros as the same in CLI :
| Parameter | Value |
|---|---|
| FILTERMETRICS | prometheus_http_requests_total |
| WARNING | 5000 |
| CRITICAL | 10000 |
| INSTANCE | handler |
| FILTERINSTANCE | /api/v1/query_range |
| SUBINSTANCE | code |
| FILTERSUBINTACE | 200 |
| EXTRAOPTIONS | --verbose |
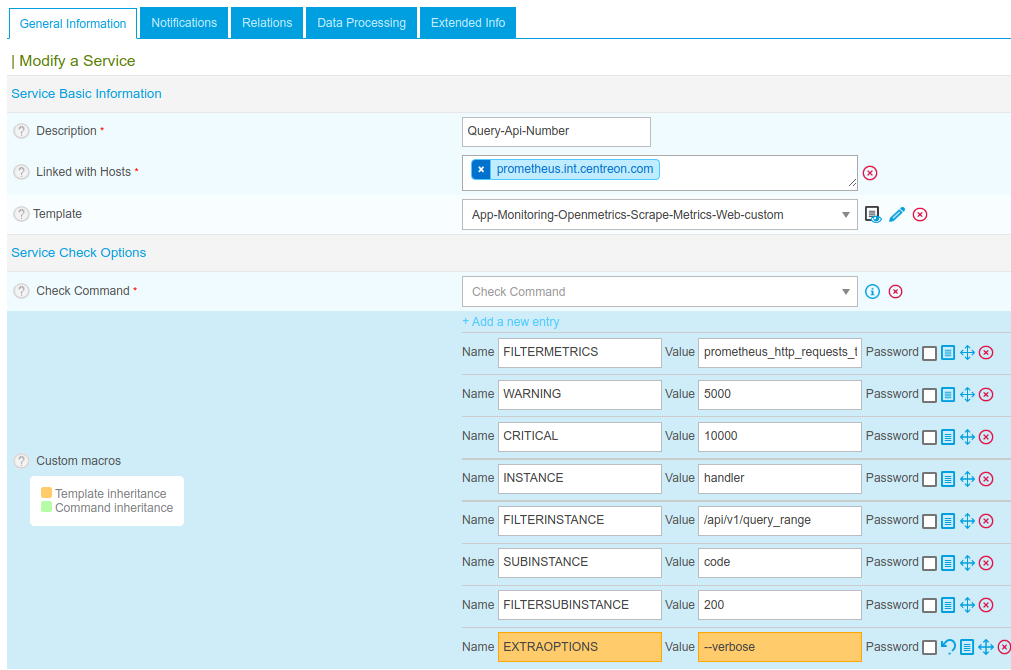
And we rename the service by "Query-Api-Number". This service could be duplicate and modificate to collect other Openmetrics and get alerting/reporting: