Kubernetes API
Pack assets
Preamble
The following monitoring connectors will be installed when you install the Kubernetes API connector through the Configuration > Connectors > Monitoring Connectors menu:
This Pack aims to monitor both the infrastructure layer (nodes) and the cluster services (deployments, daemonsets, etc) of a Kubernetes cluster. The Kubernetes API pack gives multiple choices regarding the way you can arrange cluster monitoring. There are mainly three ways:
- Gather all metrics on only one Centreon host with a service per Kubernetes unit (i.e. deployments, daemonsets, etc) - apply manual creation procedure,
- Gather all metrics on only one Centreon host with a service for each instance of each Kubernetes unit - apply manual creation and service discovery procedures,
- Collect infrastructural metrics (master and worker nodes) with a Centreon host per Kubernetes node, and keep orchestration/application metrics on a unique host (using one of the 2 previous scenarios) - apply the host discovery procedure.
Templates
The Monitoring Connector Kubernetes API brings 2 host templates:
- Cloud-Kubernetes-Api-custom
- Cloud-Kubernetes-Kubectl-custom
- Cloud-Kubernetes-Node-Api-custom
- Cloud-Kubernetes-Node-Kubectl-custom
The connector brings the following service templates (sorted by the host template they are attached to):
- Cloud-Kubernetes-Api-custom
- Cloud-Kubernetes-Kubectl-custom
- Cloud-Kubernetes-Node-Api-custom
- Cloud-Kubernetes-Node-Kubectl-custom
| Service Alias | Service Template | Service Description | Discovery |
|---|---|---|---|
| Cluster-Events | Cloud-Kubernetes-Cluster-Events-Api-custom | Check the number of events occurring in the cluster | |
| CronJob-Status | Cloud-Kubernetes-CronJob-Status-Api-custom | Check CronJobs status | X |
| Daemonset-Status | Cloud-Kubernetes-Daemonset-Status-Api-custom | Check DaemonSets status | X |
| Deployment-Status | Cloud-Kubernetes-Deployment-Status-Api-custom | Check Deployments status | X |
| Node-Status | Cloud-Kubernetes-Node-Status-Api-custom | Check Nodes status | |
| Node-Status | Cloud-Kubernetes-Node-Status-Name-Api-custom | Check status of a node identified by its name (for example at the end of the associated discovery rule) | X |
| Node-Usage | Cloud-Kubernetes-Node-Usage-Api-custom | Check nodes usage | |
| Node-Usage | Cloud-Kubernetes-Node-Usage-Name-Api-custom | Check the usage of a node identified by its name (for example at the end of the associated discovery rule) | X |
| PersistentVolume-Status | Cloud-Kubernetes-PersistentVolume-Status-Api-custom | Check PersistentVolumes status | X |
| Pod-Status | Cloud-Kubernetes-Pod-Status-Api-custom | Check pods and containers status | X |
| ReplicaSet-Status | Cloud-Kubernetes-ReplicaSet-Status-Api-custom | Check ReplicaSets status | X |
| ReplicationController-Status | Cloud-Kubernetes-ReplicationController-Status-Api-custom | Check ReplicationControllers status | X |
| ResourceQuota-Status | Cloud-Kubernetes-ResourceQuota-Status-Api-custom | Check ResourceQuota status | X |
| StatefulSet-Status | Cloud-Kubernetes-StatefulSet-Status-Api-custom | Check StatefulSets status | X |
The services listed above are created automatically when the Cloud-Kubernetes-Api-custom host template is used.
If Discovery is checked, it means a service discovery rule exists for this service template.
| Service Alias | Service Template | Service Description | Discovery |
|---|---|---|---|
| Cluster-Events | Cloud-Kubernetes-Cluster-Events-Api-custom | Check the number of events occurring in the cluster | |
| CronJob-Status | Cloud-Kubernetes-CronJob-Status-Api-custom | Check CronJobs status | X |
| Daemonset-Status | Cloud-Kubernetes-Daemonset-Status-Api-custom | Check DaemonSets status | X |
| Deployment-Status | Cloud-Kubernetes-Deployment-Status-Api-custom | Check Deployments status | X |
| Node-Status | Cloud-Kubernetes-Node-Status-Api-custom | Check Nodes status | |
| Node-Status | Cloud-Kubernetes-Node-Status-Name-Api-custom | Check the status of a node identified by its name (for example at the end of the associated discovery rule) | X |
| Node-Usage | Cloud-Kubernetes-Node-Usage-Api-custom | Check nodes usage | |
| Node-Usage | Cloud-Kubernetes-Node-Usage-Name-Api-custom | Check the usage of a node identified by its name (for example at the end of the associated discovery rule) | X |
| PersistentVolume-Status | Cloud-Kubernetes-PersistentVolume-Status-Api-custom | Check PersistentVolumes status | X |
| Pod-Status | Cloud-Kubernetes-Pod-Status-Api-custom | Check pods and containers status | X |
| ReplicaSet-Status | Cloud-Kubernetes-ReplicaSet-Status-Api-custom | Check ReplicaSets status | X |
| ReplicationController-Status | Cloud-Kubernetes-ReplicationController-Status-Api-custom | Check ReplicationControllers status | X |
| ResourceQuota-Status | Cloud-Kubernetes-ResourceQuota-Status-Api-custom | Check ResourceQuota status | X |
| StatefulSet-Status | Cloud-Kubernetes-StatefulSet-Status-Api-custom | Check StatefulSets status | X |
The services listed above are created automatically when the Cloud-Kubernetes-Kubectl-custom host template is used.
If Discovery is checked, it means a service discovery rule exists for this service template.
| Service Alias | Service Template | Service Description | Discovery |
|---|---|---|---|
| Node-Status | Cloud-Kubernetes-Node-Status-Api-custom | Check Nodes status | |
| Node-Status | Cloud-Kubernetes-Node-Status-Name-Api-custom | Check the status of a node identified by its name (for example at the end of the associated discovery rule) | X |
| Node-Usage | Cloud-Kubernetes-Node-Usage-Api-custom | Check nodes usage | |
| Node-Usage | Cloud-Kubernetes-Node-Usage-Name-Api-custom | Check the usage of a node identified by its name (for example at the end of the associated discovery rule) | X |
The services listed above are created automatically when the Cloud-Kubernetes-Node-Api-custom host template is used.
If Discovery is checked, it means a service discovery rule exists for this service template.
| Service Alias | Service Template | Service Description | Discovery |
|---|---|---|---|
| Node-Status | Cloud-Kubernetes-Node-Status-Api-custom | Check Nodes status | |
| Node-Status | Cloud-Kubernetes-Node-Status-Name-Api-custom | Check the status of a node identified by its name (for example at the end of the associated discovery rule) | X |
| Node-Usage | Cloud-Kubernetes-Node-Usage-Api-custom | Check nodes usage | |
| Node-Usage | Cloud-Kubernetes-Node-Usage-Name-Api-custom | Check the usage of a node identified by its name (for example at the end of the associated discovery rule) | X |
The services listed above are created automatically when the Cloud-Kubernetes-Node-Kubectl-custom host template is used.
If Discovery is checked, it means a service discovery rule exists for this service template.
Discovery rules
Host discovery
| Rule name | Description |
|---|---|
| Kubernetes Nodes (RestAPI) | Discover Kubernetes cluster nodes by requesting the Kubernetes RestAPI |
| Kubernetes Nodes (Kubectl) | Discover Kubernetes cluster nodes by requesting the Kubernetes cluster using kubectl |
| Kubernetes Namespaces (RestAPI) | Discover Kubernetes cluster namespaces by requesting the Kubernetes RestAPI |
| Kubernetes Namespaces (Kubectl) | Discover Kubernetes cluster namespaces by requesting the Kubernetes cluster using kubectl |
More information about discovering hosts automatically is available on the dedicated page.
Service discovery
| Rule name | Description |
|---|---|
| Cloud-Kubernetes-Api-CronJobs-Status | Discover Kubernetes CronJobs to monitor their status |
| Cloud-Kubernetes-Api-Daemonsets-Status | Discover Kubernetes DaemonSets to monitor their status |
| Cloud-Kubernetes-Api-Deployments-Status | Discover Kubernetes Deployments to monitor their status |
| Cloud-Kubernetes-Api-Nodes-Status | Discover Kubernetes Nodes to monitor their status |
| Cloud-Kubernetes-Api-Nodes-Usage | Discover Kubernetes Nodes to monitor their usage |
| Cloud-Kubernetes-Api-PersistentVolumes-Status | Discover Kubernetes PersistentVolumes to monitor their status |
| Cloud-Kubernetes-Api-Pods-Status | Discover Kubernetes Pods to monitor their status |
| Cloud-Kubernetes-Api-ReplicaSets-Status | Discover Kubernetes ReplicaSets to monitor their status |
| Cloud-Kubernetes-Api-ReplicationControllers-Status | Discover Kubernetes ReplicationControllers to monitor their status |
| Cloud-Kubernetes-Api-ResourceQuota-Status | Discover Kubernetes ResourceQuotas to monitor their status |
| Cloud-Kubernetes-Api-StatefulSets-Status | Discover Kubernetes StatefulSets to monitor their status |
More information about discovering services automatically is available on the dedicated page and in the following chapter.
Collected metrics & status
Here is the list of services for this connector, detailing all metrics and statuses linked to each service.
- Cluster-Events
- CronJob-Status
- Daemonset-Status
- Deployment-Status
- Node-Status*
- Node-Usage*
- PersistentVolume-Status
- Pod-Status
- ReplicaSet-Status
- ReplicationController-Status
- ResourceQuota-Status
- StatefulSet-Status
| Metric name | Unit |
|---|---|
| events.type.warning.count | count |
| events.type.normal.count | count |
| events#status | N/A |
| Metric name | Unit |
|---|---|
| cronjobs#cronjob.jobs.active.count | count |
| Metric name | Unit |
|---|---|
| daemonsets#daemonset.pods.misscheduled.count | count |
| Metric name | Unit |
|---|---|
| deployments#deployment.replicas.uptodate.count | count |
| Metric name | Unit |
|---|---|
| nodes~conditions#status | N/A |
Applies to the following service templates: Node-Status, Node-Status
| Metric name | Unit |
|---|---|
| nodes#cpu.requests.percentage | % |
| nodes#cpu.limits.percentage | % |
| nodes#memory.requests.percentage | % |
| nodes#memory.limits.percentage | % |
| nodes#pods.allocation.percentage | % |
Applies to the following service templates: Node-Usage, Node-Usage
| Metric name | Unit |
|---|---|
| pvs#status | N/A |
| Metric name | Unit |
|---|---|
| pods~containers.ready.count | count |
| pods~pod-status | N/A |
| pods~restarts.total.count | count |
| pods~containers#container-status | N/A |
| pods~containers#containers.restarts.count | count |
| Metric name | Unit |
|---|---|
| replicasets#replicaset.replicas.ready.count | count |
| Metric name | Unit |
|---|---|
| rcs#replicationcontroller.replicas.ready.count | count |
| Metric name | Unit |
|---|---|
| rqs#resource.usage.percent | % |
| Metric name | Unit |
|---|---|
| statefulsets#statefulset.replicas.ready.count | count |
Additional information on metrics and services
- Cluster-Events
- CronJob-Status
- Daemonset-Status
- Deployment-Status
- Node-Status*
- Node-Usage*
- PersistentVolume-Status
- Pod-Status
- ReplicaSet-Status
- ReplicationController-Status
- StatefulSet-Status
This indicator allows you to watch the number of events occurring on the cluster. If the kubectl get events command has the following output:
NAMESPACE   LAST SEEN   TYPE      REASON      OBJECT           MESSAGE
graphite    26m         Warning   Unhealthy   pod/graphite-0   Liveness probe failed: Get "http://10.244.2.10:8080/": context deadline exceeded (Client.Timeout exceeded while awaiting headers)
Then the resulting output in Centreon could look like:
Event 'Warning' for object 'Pod/graphite-0' with message 'Liveness probe failed: Get "http://10.244.2.10:8080/": context deadline exceeded (Client.Timeout exceeded while awaiting headers)', Count: 1, First seen: 26m 21s ago (2021-03-11T12:26:23Z), Last seen: 26m 21s ago (2021-03-11T12:26:23Z)
This indicator allows to check that CronJobs are executed as they should. If the kubectl get cronjobs command has the following output:
NAME    SCHEDULE      SUSPEND   ACTIVE   LAST SCHEDULE   AGE
hello   */1 * * * *   False     1        6s              2d1h
Then the resulting output in Centreon could look like:
CronJob 'hello' Jobs Active: 1, Last schedule time: 6s ago (2021-03-11T12:31:00Z)
If the service collects metrics for several CronJobs (depending on the chosen scenario), the CronJob's name will be appended to the metric's name:
| Metric |
|---|
hello#cronjob.jobs.active.count |
This indicator will ensure that DaemonSets are within defined bounds by
looking at the number of available and/or up-to-date pods compared to
the desired count. If the kubectl get daemonsets command has the following output:
NAMESPACE     NAME                    DESIRED   CURRENT   READY   UP-TO-DATE   AVAILABLE   NODE SELECTOR                   AGE
kube-system   kube-flannel-ds-amd64   3         3         3       3            3           beta.kubernetes.io/arch=amd64   624d
kube-system   kube-proxy              3         3         3       3            3           kubernetes.io/os=linux          624d
Then the resulting output in Centreon could look like:
Daemonset 'kube-flannel-ds-amd64' Pods Desired: 3, Current: 3, Available: 3, Up-to-date: 3, Ready: 3, Misscheduled: 0
Daemonset 'kube-proxy' Pods Desired: 3, Current: 3, Available: 3, Up-to-date: 3, Ready: 3, Misscheduled: 0
If the service collects metrics for several DaemonSets (depending on the chosen scenario), the DaemonSet's name will be appended to the metric's name:
| Metric |
|---|
kube-proxy#daemonset.pods.desired.count |
This indicator will ensure that Deployments are within defined bounds by
looking at the number of available and/or up-to-date replicas compared to
the desired count. If the kubectl get deployments command has the following output:
NAMESPACE              NAME                        READY   UP-TO-DATE   AVAILABLE   AGE
kube-system            coredns                     2/2     2            2           624d
kube-system            tiller-deploy               1/1     1            1           624d
kubernetes-dashboard   dashboard-metrics-scraper   1/1     1            1           37d
kubernetes-dashboard   kubernetes-dashboard        1/1     1            1           37d
Then the resulting output in Centreon could look like:
Deployment 'coredns' Replicas Desired: 2, Current: 2, Available: 2, Ready: 2, Up-to-date: 2
Deployment 'tiller-deploy' Replicas Desired: 1, Current: 1, Available: 1, Ready: 1, Up-to-date: 1
Deployment 'dashboard-metrics-scraper' Replicas Desired: 1, Current: 1, Available: 1, Ready: 1, Up-to-date: 1
Deployment 'kubernetes-dashboard' Replicas Desired: 1, Current: 1, Available: 1, Ready: 1, Up-to-date: 1
If the service collects metrics for several Deployments (depending on the chosen scenario), the Deployment's name will be appended to the metric's name:
| Metric |
|---|
tiller-deploy#deployment.replicas.desired.count |
This indicator will ensure that Nodes are running well by looking at the
conditions statuses. If the kubectl describe nodes command has the following output:
Conditions:
  Type             Status  LastHeartbeatTime                 LastTransitionTime                Reason                       Message
  ----             ------  -----------------                 ------------------                ------                       -------
  MemoryPressure   False   Thu, 11 Mar 2021 14:20:25 +0100   Tue, 26 Jan 2021 09:38:11 +0100   KubeletHasSufficientMemory   kubelet has sufficient memory available
  DiskPressure     False   Thu, 11 Mar 2021 14:20:25 +0100   Wed, 17 Feb 2021 09:37:40 +0100   KubeletHasNoDiskPressure     kubelet has no disk pressure
  PIDPressure      False   Thu, 11 Mar 2021 14:20:25 +0100   Tue, 26 Jan 2021 09:38:11 +0100   KubeletHasSufficientPID      kubelet has sufficient PID available
  Ready            True    Thu, 11 Mar 2021 14:20:25 +0100   Tue, 26 Jan 2021 17:26:36 +0100   KubeletReady                 kubelet is posting ready status
Then the resulting output in Centreon could look like:
Condition 'DiskPressure' Status is 'False', Reason: 'KubeletHasNoDiskPressure', Message: 'kubelet has no disk pressure'
Condition 'MemoryPressure' Status is 'False', Reason: 'KubeletHasSufficientMemory', Message: 'kubelet has sufficient memory available'
Condition 'PIDPressure' Status is 'False', Reason: 'KubeletHasSufficientPID', Message: 'kubelet has sufficient PID available'
Condition 'Ready' Status is 'True', Reason: 'KubeletReady', Message: 'kubelet is posting ready status'
This indicator will gather metrics about Nodes usage like pods allocation, requests for CPU and memory made by those pods, and limits for CPU and memory allowed to those same pods.
Using Kubernetes command line tool, it could look like the following:
-
Nodes capacity:
kubectl get nodes -o=custom-columns="NODE:.metadata.name,PODS ALLOCATABLE:.status.allocatable.pods,CPU ALLOCATABLE:.status.allocatable.cpu,MEMORY ALLOCATABLE:.status.allocatable.memory"NODE PODS ALLOCATABLE CPU ALLOCATABLE MEMORY ALLOCATABLEmaster-node 110 2 3778172Kiworker-node 110 2 3778184Ki -
Running pods:
kubectl get pods -o=custom-columns="NODE:.spec.nodeName,POD:.metadata.name,CPU REQUESTS:.spec.containers[*].resources.requests.cpu,CPU LIMITS:.spec.containers[*].resources.limits.cpu,MEMORY REQUESTS:.spec.containers[*].resources.requests.memory,MEMORY LIMITS:.spec.containers[*].resources.limits.memory"NODE POD CPU REQUESTS CPU LIMITS MEMORY REQUESTS MEMORY LIMITSworker-node coredns-74ff55c5b-g4hmt 100m <none> 70Mi 170Mimaster-node etcd-master-node 100m <none> 100Mi <none>master-node kube-apiserver-master-node 250m <none> <none> <none>master-node kube-controller-manager-master-node 200m <none> <none> <none>master-node kube-flannel-ds-amd64-fk59g 100m 100m 50Mi 50Miworker-node kube-flannel-ds-amd64-jwzms 100m 100m 50Mi 50Mimaster-node kube-proxy-kkwmb <none> <none> <none> <none>worker-node kube-proxy-vprs8 <none> <none> <none> <none>master-node kube-scheduler-master-node 100m <none> <none> <none>master-node kubernetes-dashboard-7d75c474bb-7zc5j <none> <none> <none> <none>
From the Kubernetes dashboard, the metrics can be found in the
Cluser > Nodes menu:
-
Listing from
Cluser > Nodes: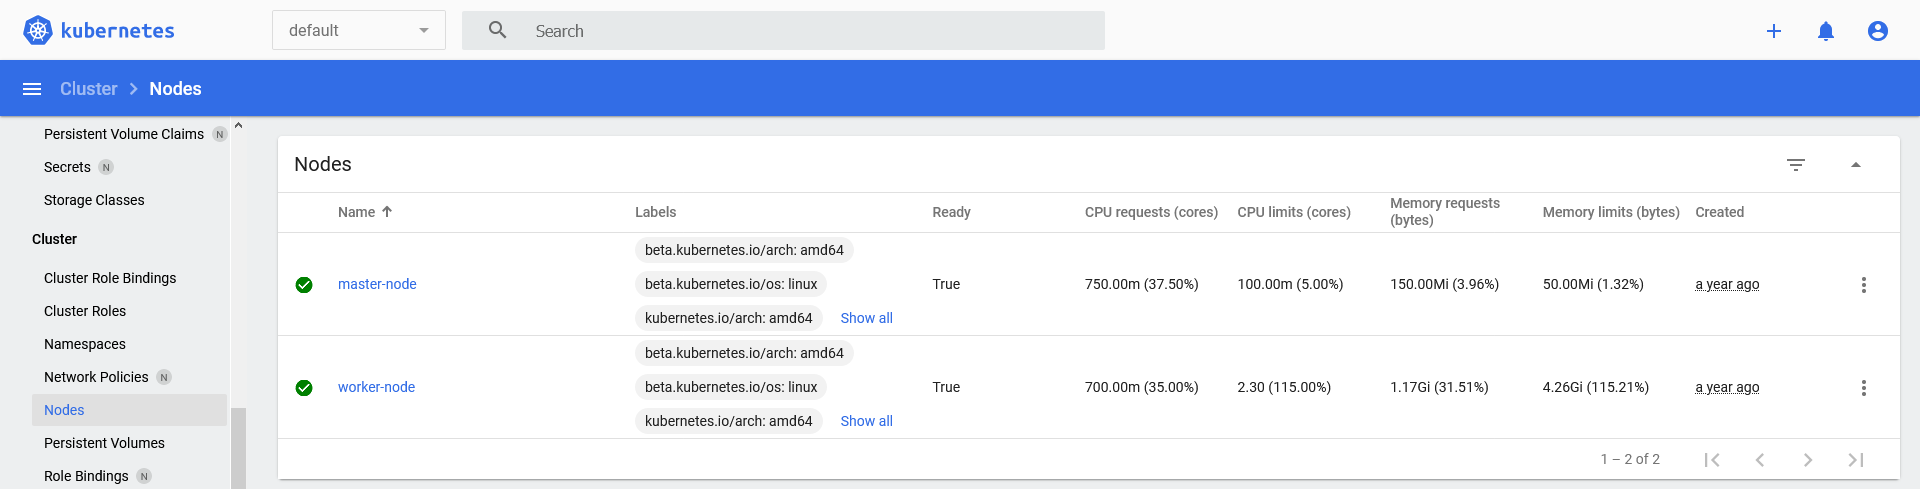
-
Allocation detail for a node:
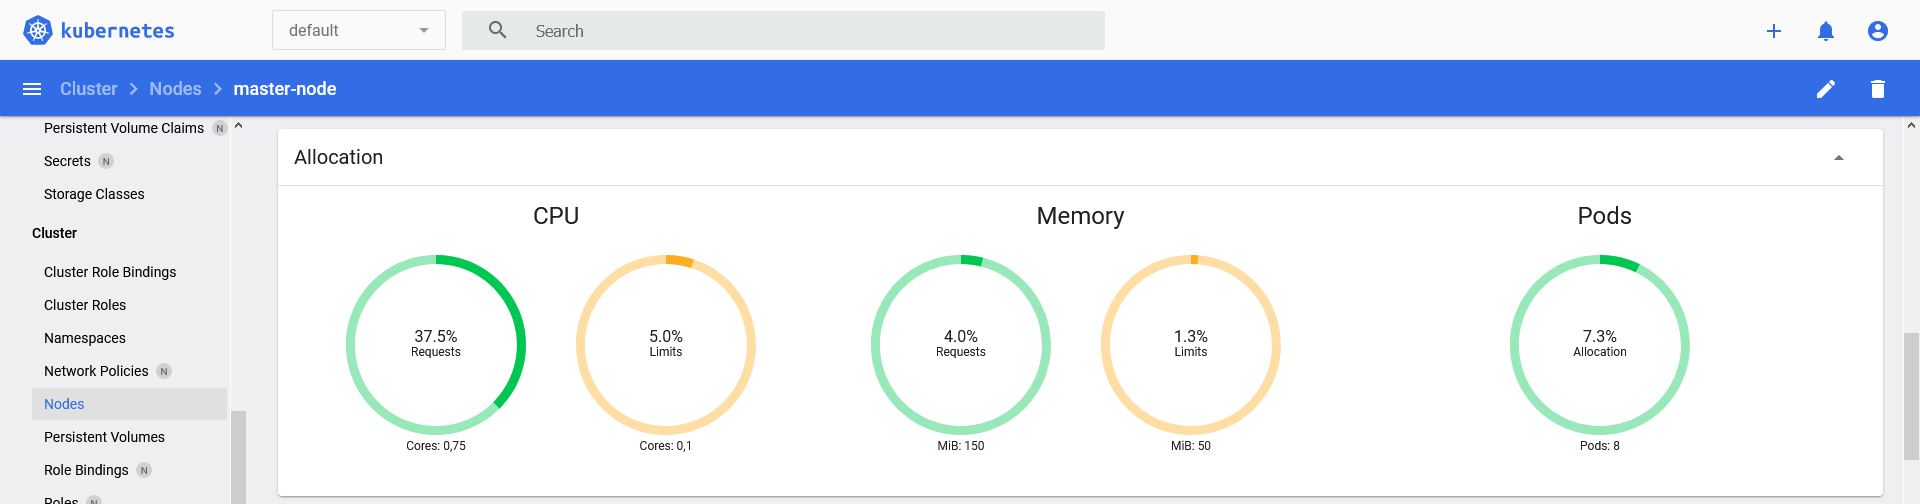
The resulting output in Centreon could look like:
Node 'master-node' CPU requests: 37.50% (0.75/2), CPU limits: 5.00% (0.1/2), Memory requests: 3.96% (150.00MB/3.70GB), Memory limits: 1.32% (50.00MB/3.70GB), Pods allocation: 7.27% (8/110)
Node 'worker-node' CPU requests: 35.00% (0.7/2), CPU limits: 115.00% (2.3/2), Memory requests: 31.51% (1.17GB/3.70GB), Memory limits: 115.21% (4.26GB/3.70GB), Pods allocation: 9.09% (10/110)
If the service collects metrics for several Nodes (depending on the chosen scenario), Node's name will be appended to the metric name:
| Metric |
|---|
worker-node#pods.allocation.percentage |
Applies to the following service templates: Node-Status, Node-Status
This indicator will ensure that PersistentVolumes are operating correctly by
looking at the phase they are in. If the kubectl get pv command has the following output:
NAME                     CAPACITY   ACCESS MODES   RECLAIM POLICY   STATUS      CLAIM                   STORAGECLASS   REASON   AGE
pv-nfs-kubestorage-001   5Gi        RWO            Retain           Available                                                   630d
pv-nfs-kubestorage-002   5Gi        RWO            Retain           Bound       tick/data-influxdb                              630d
pv-nfs-kubestorage-003   5Gi        RWO            Retain           Released    graphite/graphite-pvc                           630d
Then the resulting output in Centreon could look like:
Persistent Volume 'pv-nfs-kubestorage-001' Phase is 'Available'
Persistent Volume 'pv-nfs-kubestorage-002' Phase is 'Bound'
Persistent Volume 'pv-nfs-kubestorage-003' Phase is 'Released'
This indicator will ensure that Pods and their containers are within defined
bounds by looking at the number of ready containers compared to
the desired count. If the kubectl get pods command has the following output:
NAMESPACE              NAME                                                     READY   STATUS        RESTARTS   AGE
kube-system            kube-proxy-65zhn                                         1/1     Running       0          37d
kube-system            kube-proxy-kkwmb                                         1/1     Running       0          37d
kube-system            kube-proxy-vprs8                                         1/1     Running       0          37d
kube-system            tiller-deploy-7bf78cdbf7-z5n24                           1/1     Running       5          550d
kubernetes-dashboard   dashboard-metrics-scraper-79c5968bdc-vncxc               1/1     Running       0          37d
kubernetes-dashboard   kubernetes-dashboard-7448ffc97b-42rps                    1/1     Running       0          37d
Then the resulting output in Centreon could look like:
Checking pod 'kube-proxy-65zhn'
    Containers Ready: 1/1 (100.00%), Status is 'Running', Restarts: 0
    Container 'kube-proxy' Status is 'running', State is 'ready', Restarts: 0
Checking pod 'kube-proxy-kkwmb'
    Containers Ready: 1/1 (100.00%), Status is 'Running', Restarts: 0
    Container 'kube-proxy' Status is 'running', State is 'ready', Restarts: 0
Checking pod 'kube-proxy-vprs8'
    Containers Ready: 1/1 (100.00%), Status is 'Running', Restarts: 0
    Container 'kube-proxy' Status is 'running', State is 'ready', Restarts: 0
Checking pod 'tiller-deploy-7bf78cdbf7-z5n24'
    Containers Ready: 1/1 (100.00%), Status is 'Running', Restarts: 5
    Container 'tiller' Status is 'running', State is 'ready', Restarts: 5
Checking pod 'dashboard-metrics-scraper-79c5968bdc-vncxc'
    Containers Ready: 1/1 (100.00%), Status is 'Running', Restarts: 0
    Container 'dashboard-metrics-scraper' Status is 'running', State is 'ready', Restarts: 0
Checking pod 'kubernetes-dashboard-7448ffc97b-42rps'
    Containers Ready: 1/1 (100.00%), Status is 'Running', Restarts: 0
    Container 'kubernetes-dashboard' Status is 'running', State is 'ready', Restarts: 0
If the service collects metrics for several Pods (depending on the chosen scenario), the Pod's name and the container's name will be appended to the metric's name:
| Metric |
|---|
coredns-74ff55c5b-g4hmt#containers.ready.count |
coredns-74ff55c5b-g4hmt#restarts.total.count |
coredns-74ff55c5b-g4hmt_coredns#containers.restarts.count |
This indicator will ensure that ReplicaSets are within defined bounds by
looking at the number of ready replicas compared to the desired count. If the kubectl get replicasets command has the following output:
NAMESPACE              NAME                                   DESIRED   CURRENT   READY   AGE
kube-system            coredns-74ff55c5b                      2         2         2       44d
kube-system            tiller-deploy-7bf78cdbf7               1         1         1       630d
kubernetes-dashboard   dashboard-metrics-scraper-79c5968bdc   1         1         1       44d
kubernetes-dashboard   kubernetes-dashboard-7448ffc97b        1         1         1       44d
Then the resulting output in Centreon could look like:
ReplicaSet 'coredns-74ff55c5b' Replicas Desired: 2, Current: 2, Ready: 2
ReplicaSet 'tiller-deploy-7bf78cdbf7' Replicas Desired: 1, Current: 1, Ready: 1
ReplicaSet 'dashboard-metrics-scraper-79c5968bdc' Replicas Desired: 1, Current: 1, Ready: 1
ReplicaSet 'kubernetes-dashboard-7448ffc97b' Replicas Desired: 1, Current: 1, Ready: 1
If the service collects metrics for several ReplicaSets (depending on the chosen scenario), the ReplicaSet's name will be appended to the metric's name:
| Metric |
|---|
tiller-deploy-7bf78cdbf7#replicaset.replicas.desired.count |
This indicator will ensure that ReplicationControllers are within defined
bounds by looking at the number of ready replicas compared to the desired
count. If the kubectl get rc command has the following output:
NAMESPACE   NAME    DESIRED   CURRENT   READY   AGE
elk         nginx   3         3         3       2d19h
Then the resulting output in Centreon could look like:
ReplicationController 'nginx' Replicas Desired: 3, Current: 3, Ready: 3
If the service collects metrics for several ReplicationControllers (depending on the chosen scenario), the ReplicationController's name will be appended to the metric's name:
| Metric |
|---|
nginx#replicationcontroller.replicas.desired.count |
This indicator will ensure that StatefulSets are within defined bounds by
looking at the number of ready/up-to-date replicas compared to the desired
count. If the kubectl get statefulsets command has the following output:
NAMESPACE    NAME                                        READY   AGE
elk          elasticsearch-master                        2/2     44d
graphite     graphite                                    1/1     3d
prometheus   prometheus-prometheus-operator-prometheus   1/1     619d
Then the resulting output in Centreon could look like:
StatefulSet 'elasticsearch-master' Replicas Desired: 2, Current: 2, Up-to-date: 2, Ready: 2
StatefulSet 'graphite' Replicas Desired: 1, Current: 1, Up-to-date: 1, Ready: 1
StatefulSet 'prometheus-prometheus-operator-prometheus' Replicas Desired: 1, Current: 1, Up-to-date: 1, Ready: 1
If the service collects metrics for several StatefulSets (depending on the chosen scenario), the StatefulSet's name will be appended to the metric's name:
| Metric |
|---|
graphite#statefulset.replicas.desired.count |
Prerequisites
As mentioned in the introduction, two ways of communication are available:
- the RestAPI exposed by the Kubernetes cluster,
- the CLI tool kubectl to communicate with the cluster's control plane.
For better performances, we recommend to use the RestAPI.
Create a service account
Both flavors can use a service account with sufficient rights to access Kubernetes API.
Create a dedicated service account centreon-service-account in the
kube-system namespace to access the API:
kubectl create serviceaccount centreon-service-account --namespace kube-system
Create a cluster role api-access with needed privileges for the Plugin,
and bind it to the newly created service account:
cat <<EOF | kubectl create -f -
apiVersion: rbac.authorization.k8s.io/v1
kind: ClusterRole
metadata:
  name: api-access
rules:
  - apiGroups:
      - ""
      - apps
      - batch
    resources:
      - cronjobs
      - daemonsets
      - deployments
      - events
      - namespaces
      - nodes
      - persistentvolumes
      - pods
      - replicasets
      - replicationcontrollers
      - statefulsets
    verbs:
      - get
      - list
---
apiVersion: rbac.authorization.k8s.io/v1
kind: ClusterRoleBinding
metadata:
  name: api-access
roleRef:
  apiGroup: rbac.authorization.k8s.io
  kind: ClusterRole
  name: api-access
subjects:
- kind: ServiceAccount
  name: centreon-service-account
  namespace: kube-system
EOF
Refer to the official documentation for service account creation or information about secret concept.
Kubectl version 1.24 and above
In versions prior to Kubernetes 1.24, each service account created automatically received a JWT (JSON Web Token) secret token mounted in the associated pods. Starting with Kubernetes 1.24, these automatic tokens are no longer generated by default.
To manually create a token, refer to the official Kubernetes documentation: Manually create a long-lived API token for a Service Account.
Using RestAPI
If you chose to communicate with your Kubernetes platform's RestAPI, the following prerequisites need to be matched:
- Expose the API with TLS,
- Retrieve token from service account.
Expose the API
As the API is using HTTPS, you will need a certificate.
You can make an auto-signed key/certificate couple with the following command:
openssl req -x509 -nodes -days 365 -newkey rsa:2048 -keyout /etc/ssl/private/kubernetesapi.key -out /etc/ssl/certs/kubernetesapi.crt
Then load it as api-certificate into the cluster, from the master node:
kubectl create secret tls api-certificate --key /etc/ssl/private/kubernetesapi.key --cert /etc/ssl/certs/kubernetesapi.crt
The ingress can now be created:
cat <<EOF | kubectl create -f -
apiVersion: networking.k8s.io/v1
kind: Ingress
metadata:
  name: kubernetesapi-ingress
  namespace: default
  annotations:
    kubernetes.io/ingress.class: "nginx"
    nginx.ingress.kubernetes.io/backend-protocol: "HTTPS"
spec:
  tls:
    - hosts:
	@@ -671,10 +671,13 @@ spec:
  - host: kubernetesapi.local.domain
    http:
      paths:
      - path: /
        pathType: ImplementationSpecific
        backend:
          service:
            name: kubernetes
            port:
              number: 443
EOF
Adapt the host entry to your needs.
Refer to the official documentation for ingresses management.
Retrieve token from service account
Retrieve the secret name from the previously created service account:
kubectl get serviceaccount centreon-service-account --namespace kube-system --output jsonpath='{.secrets[].name}'
Then retrieve the token from the service account secret:
kubectl get secrets centreon-service-account-token-xqw7m --namespace kube-system --output jsonpath='{.data.token}' | base64 --decode
This token will be used later for Centreon host configuration.
Using kubectl
If you chose to communicate with the cluster's control plane with kubectl, the following prerequisites need to be matched:
- Install the kubectl tool,
- Create a kubectl configuration.
Those actions are needed on all Pollers that will do Kubernetes monitoring.
Install kubectl
Download the latest release with the following command:
curl -LO "https://dl.k8s.io/release/$(curl -L -s https://dl.k8s.io/release/stable.txt)/bin/linux/amd64/kubectl"
Be sure to download a version within one minor version difference of your cluster. To download a specific version, change the embedded curl in the command above by the version. For example if you want to download the version
v1.20.0:curl -LO "https://dl.k8s.io/release/v1.20.0/bin/linux/amd64/kubectl"
Install the tool in the binaries directory:
sudo install -o root -g root -m 0755 kubectl /usr/local/bin/kubectl
Refer to the official documentation for more details.
Create a kubectl configuration
To access the cluster, kubectl needs a configuration file with all needed information.
Here is an example of a configuration file creation based on a service account (created in previous chapter).
You will need to fill the following information and execute the commands on the master node:
ip=<master node ip>
port=<api port>
account=centreon-service-account
namespace=kube-system
clustername=my-kube-cluster
context=my-kube-cluster
secret=$(kubectl get serviceaccount $account --namespace $namespace --output jsonpath='{.secrets[].name}')
ca=$(kubectl get secret $secret --namespace $namespace --output jsonpath='{.data.ca\.crt}')
token=$(kubectl get secret $secret --namespace $namespace --output jsonpath='{.data.token}' | base64 --decode)
The account name and namespace must match with the account created earlier. All others need to be adapted.
Then execute this command to generate the config file :
cat <<EOF >> config
apiVersion: v1
kind: Config
clusters:
- name: ${clustername}
  cluster:
    certificate-authority-data: ${ca}
    server: https://${ip}:${port}
contexts:
- name: ${context}
  context:
    cluster: ${clustername}
    namespace: ${namespace}
    user: ${account}
current-context: ${context}
users:
- name: ${account}
  user: ${token}
EOF
This will create a config file. This file must be copied to the Pollers
Engine user's home, usually in a .kube directory (i.e.
/var/lib/centreon-engine/.kube/config).
This path will be used later in Centreon host configuration.
You may also want to copy the configuration to Gorgone user's home if using Host Discovery.
Refer to the official documentation for more details.
Installing the monitoring connector
Pack
The installation procedures for monitoring connectors are slightly different depending on whether your license is offline or online.
- If the platform uses an online license, you can skip the package installation instruction below as it is not required to have the connector displayed within the Configuration > Connectors > Monitoring Connectors menu. If the platform uses an offline license, install the package on the central server with the command corresponding to the operating system's package manager:
- Alma / RHEL / Oracle Linux 8
- Alma / RHEL / Oracle Linux 9
- Debian 11 & 12
- CentOS 7
dnf install centreon-pack-cloud-kubernetes-api
dnf install centreon-pack-cloud-kubernetes-api
apt install centreon-pack-cloud-kubernetes-api
yum install centreon-pack-cloud-kubernetes-api
- Whatever the license type (online or offline), install the Kubernetes API connector through the Configuration > Connectors > Monitoring Connectors menu.
Plugin
Since Centreon 22.04, you can benefit from the 'Automatic plugin installation' feature. When this feature is enabled, you can skip the installation part below.
You still have to manually install the plugin on the poller(s) when:
- Automatic plugin installation is turned off
- You want to run a discovery job from a poller that doesn't monitor any resource of this kind yet
More information in the Installing the plugin section.
Use the commands below according to your operating system's package manager:
- Alma / RHEL / Oracle Linux 8
- Alma / RHEL / Oracle Linux 9
- Debian 11 & 12
- CentOS 7
dnf install centreon-plugin-Cloud-Kubernetes-Api
dnf install centreon-plugin-Cloud-Kubernetes-Api
apt install centreon-plugin-cloud-kubernetes-api
yum install centreon-plugin-Cloud-Kubernetes-Api
Using the monitoring connector
Using a host template provided by the connector
- Cloud-Kubernetes-Api-custom
- Cloud-Kubernetes-Kubectl-custom
- Cloud-Kubernetes-Node-Api-custom
- Cloud-Kubernetes-Node-Kubectl-custom
- Log into Centreon and add a new host through Configuration > Hosts.
- Fill in the Name, Alias & IP Address/DNS fields according to your resource's settings.
- Apply the Cloud-Kubernetes-Api-custom template to the host. A list of macros appears. Macros allow you to define how the connector will connect to the resource, and to customize the connector's behavior.
- Fill in the macros you want. Some macros are mandatory, in particular the macro for defining the custom mode, i.e. the connection method to the resource.
| Macro | Description | Default value | Mandatory |
|---|---|---|---|
| KUBERNETESAPIHOSTNAME | Hostname or address of the Kubernetes API service | X | |
| KUBERNETESAPITOKEN | Token retrieved from service account | X | |
| KUBERNETESAPIPROTO | Specify https if needed | https | |
| KUBERNETESAPIPORT | API port | 443 | |
| KUBERNETESAPICUSTOMMODE | When a plugin offers several ways (CLI, library, etc.) to get information the desired one must be defined with this option | api | |
| KUBERNETESAPINAMESPACE | Set namespace to get informations | ||
| KUBERNETESNODENAME | Filter StatefulSet name (can be a regexp) | ||
| PROXYURL | Proxy URL if any | ||
| TIMEOUT | Set timeout in seconds | 10 | |
| EXTRAOPTIONS | Any extra option you may want to add to every command (a --verbose flag for example). All options are listed here. |
- Deploy the configuration. The host appears in the list of hosts, and on the Resources Status page. The command that is sent by the connector is displayed in the details panel of the host: it shows the values of the macros.
For the host discovery: set the token retrieved ealier from the service account,
- Log into Centreon and add a new host through Configuration > Hosts.
- Fill in the Name, Alias & IP Address/DNS fields according to your resource's settings.
- Apply the Cloud-Kubernetes-Kubectl-custom template to the host. A list of macros appears. Macros allow you to define how the connector will connect to the resource, and to customize the connector's behavior.
- Fill in the macros you want. Some macros are mandatory, in particular the macro for defining the custom mode, i.e. the connection method to the resource.
| Macro | Description | Default value | Mandatory |
|---|---|---|---|
| KUBECTLCONFIGFILE | Kubernetes configuration file path. | ~/.kube/config | X |
| KUBERNETESAPICUSTOMMODE | When a plugin offers several ways (CLI, library, etc.) to get information the desired one must be defined with this option | kubectl | |
| KUBERNETESNODENAME | Filter StatefulSet name (can be a regexp) | ||
| PROXYURL | Proxy URL if any | ||
| TIMEOUT | Set timeout in seconds | 10 | |
| EXTRAOPTIONS | Any extra option you may want to add to every command (a --verbose flag for example). Toutes les options sont listées ici. |
- Deploy the configuration. The host appears in the list of hosts, and on the Resources Status page. The command that is sent by the connector is displayed in the details panel of the host: it shows the values of the macros.
For the host discovery: set the path to the created configuration file (prefer using relative path to make it work for both discovery and monitoring, i.e.
~/.kube/config).
- Log into Centreon and add a new host through Configuration > Hosts.
- Fill in the Name, Alias & IP Address/DNS fields according to your resource's settings.
- Apply the Cloud-Kubernetes-Node-Api-custom template to the host. A list of macros appears. Macros allow you to define how the connector will connect to the resource, and to customize the connector's behavior.
- Fill in the macros you want. Some macros are mandatory, in particular the macro for defining the custom mode, i.e. the connection method to the resource.
| Macro | Description | Default value | Mandatory |
|---|---|---|---|
| KUBERNETESAPIHOSTNAME | Hostname or address of the Kubernetes API service | X | |
| KUBERNETESAPITOKEN | Token retrieved from service account | X | |
| KUBERNETESAPIPROTO | Specify https if needed | https | |
| KUBERNETESAPIPORT | API port | 443 | |
| KUBERNETESAPICUSTOMMODE | When a plugin offers several ways (CLI, library, etc.) to get information the desired one must be defined with this option | api | |
| KUBERNETESAPINAMESPACE | Set namespace to get informations | ||
| KUBERNETESNODENAME | Filter node name (can be a regexp) | ||
| PROXYURL | Proxy URL if any | ||
| TIMEOUT | Set timeout in seconds | 10 | |
| EXTRAOPTIONS | Any extra option you may want to add to every command (a --verbose flag for example). All options are listed here. |
- Deploy the configuration. The host appears in the list of hosts, and on the Resources Status page. The command that is sent by the connector is displayed in the details panel of the host: it shows the values of the macros.
For the host discovery: set the token retrieved ealier from the service account,
- If using kubectl: set the path to the created configuration file (prefer using relative path to make it work for both discovery and monitoring, i.e.
~/.kube/config).
- Log into Centreon and add a new host through Configuration > Hosts.
- Fill in the Name, Alias & IP Address/DNS fields according to your resource's settings.
- Apply the Cloud-Kubernetes-Node-Kubectl-custom template to the host. A list of macros appears. Macros allow you to define how the connector will connect to the resource, and to customize the connector's behavior.
- Fill in the macros you want. Some macros are mandatory, in particular the macro for defining the custom mode, i.e. the connection method to the resource.
| Macro | Description | Default value | Mandatory |
|---|---|---|---|
| KUBECTLCONFIGFILE | Kubernetes configuration file path. | ~/.kube/config | X |
| KUBERNETESAPICUSTOMMODE | When a plugin offers several ways (CLI, library, etc.) to get information the desired one must be defined with this option | kubectl | |
| KUBERNETESNODENAME | Filter StatefulSet name (can be a regexp) | ||
| PROXYURL | Proxy URL if any | ||
| TIMEOUT | Set timeout in seconds | 10 | |
| EXTRAOPTIONS | Any extra option you may want to add to every command (a --verbose flag for example). Toutes les options sont listées ici. |
- Deploy the configuration. The host appears in the list of hosts, and on the Resources Status page. The command that is sent by the connector is displayed in the details panel of the host: it shows the values of the macros.
For the host discovery: set the path to the created configuration file (prefer using relative path to make it work for both discovery and monitoring, i.e.
~/.kube/config).
Using a service template provided by the connector
- If you have used a host template and checked Create Services linked to the Template too, the services linked to the template have been created automatically, using the corresponding service templates. Otherwise, create manually the services you want and apply a service template to them.
- Fill in the macros you want (e.g. to change the thresholds for the alerts). Some macros are mandatory (see the table below).
- Cluster-Events
- CronJob-Status
- Daemonset-Status
- Deployment-Status
- Node-Status
- Node-Usage
- PersistentVolume-Status
- Pod-Status
- ReplicaSet-Status
- ReplicationController-Status
- ResourceQuota-Status
- StatefulSet-Status
| Macro | Description | Default value | Mandatory |
|---|---|---|---|
| FILTERTYPE | Filter event type (can be a regexp) | .* | |
| FILTERNAMESPACE | Filter namespace (can be a regexp) | .* | |
| WARNINGSTATUS | Define the conditions to match for the status to be WARNING (default: '%{type} =~ /warning/i') Can use special variables like: %{name}, %{namespace}, %{type}, %{object}, %{message}, %{count}, %{first_seen}, %{last_seen} | %{type} =~ /warning/i | |
| CRITICALSTATUS | Define the conditions to match for the status to be CRITICAL (default: '%{type} =~ /error/i'). Can use special variables like: %{name}, %{namespace}, %{type}, %{object}, %{message}, %{count}, %{first_seen}, %{last_seen} | %{type} =~ /error/i | |
| EXTRAOPTIONS | Any extra option you may want to add to the command (a --verbose flag for example). All options are listed here. | --verbose |
| Macro | Description | Default value | Mandatory |
|---|---|---|---|
| FILTERCRONJOB | Filter CronJob name (can be a regexp) | .* | |
| FILTERNAMESPACE | Filter CronJob namespace (can be a regexp) | .* | |
| WARNINGSTATUS | Define the conditions to match for the status to be WARNING (default: '') You can use the following variables: %{name}, %{namespace}, %{active}, %{last_schedule} | ||
| CRITICALSTATUS | Define the conditions to match for the status to be CRITICAL (default: ''). You can use the following variables: %{name}, %{namespace}, %{active}, %{last_schedule} | ||
| EXTRAOPTIONS | Any extra option you may want to add to the command (a --verbose flag for example). All options are listed here. | --verbose |
| Macro | Description | Default value | Mandatory |
|---|---|---|---|
| FILTERDAEMONSET | Filter DaemonSet name (can be a regexp) | .* | |
| EXCLUDE_DAEMONSET | Exclude DaemonSet name (can be a regexp) | ||
| FILTERNAMESPACE | Filter DaemonSet namespace (can be a regexp) | .* | |
| EXCLUDE_NAMESPACE | Exclude DaemonSet namespace (can be a regexp) | ||
| WARNINGSTATUS | Define the conditions to match for the status to be WARNING (default: '%{up_to_date} < %{desired}') You can use the following variables: %{name}, %{namespace}, %{desired}, %{current}, %{available}, %{unavailable}, %{up_to_date}, %{ready}, %{misscheduled} | %{up_to_date} < %{desired} | |
| CRITICALSTATUS | Define the conditions to match for the status to be CRITICAL (default: '%{available} < %{desired}'). You can use the following variables: %{name}, %{namespace}, %{desired}, %{current}, %{available}, %{unavailable}, %{up_to_date}, %{ready}, %{misscheduled} | %{available} < %{desired} | |
| EXTRAOPTIONS | Any extra option you may want to add to the command (a --verbose flag for example). All options are listed here. | --verbose |
| Macro | Description | Default value | Mandatory |
|---|---|---|---|
| FILTERDEPLOYMENT | Filter deployment name (can be a regexp) | .* | |
| EXCLUDE_DEPLOYMENT | Exclude deployment name (can be a regexp) | ||
| FILTERNAMESPACE | Filter deployment namespace (can be a regexp) | .* | |
| EXCLUDE_NAMESPACE | Exclude deployment namespace (can be a regexp) | ||
| INCLUDE_LABEL | Include deployments matching the specified label filters. Filters are provided as a comma-separated list in the format key or key=value, where both key and value may be a regexp | ||
| EXCLUDE_LABEL | Exclude deployments matching the specified label filters. Filters are provided as a comma-separated list in the format key or key=value, where both key and value may be a regexp | ||
| WARNINGSTATUS | Define the conditions to match for the status to be WARNING (default: '%{up_to_date} < %{desired}') You can use the following variables: %{name}, %{namespace}, %{desired}, %{current}, %{available}, %{unavailable}, %{up_to_date} | %{up_to_date} < %{desired} | |
| CRITICALSTATUS | Define the conditions to match for the status to be CRITICAL (default: '%{available} < %{desired}'). You can use the following variables: %{name}, %{namespace}, %{desired}, %{current}, %{available}, %{unavailable}, %{up_to_date} | %{available} < %{desired} | |
| EXTRAOPTIONS | Any extra option you may want to add to the command (a --verbose flag for example). All options are listed here. | --verbose |
| Macro | Description | Default value | Mandatory |
|---|---|---|---|
| CRITICALSTATUS | Define the conditions to match for the status to be CRITICAL (default: '(%{type} =~ /Ready/i && %{status} !~ /True/i) || (%{type} =~ /.*Pressure/i && %{status} !~ /False/i)'). You can use the following variables: %{type}, %{status}, %{reason}, %{message}, %{name} | (%{type} =~ /Ready/i && %{status} !~ /True/i) || (%{type} =~ /.*Pressure/i && %{status} !~ /False/i) | |
| WARNINGSTATUS | Define the conditions to match for the status to be WARNING (default: ''). You can use the following variables: %{type}, %{status}, %{reason}, %{message}, %{name} | ||
| EXTRAOPTIONS | Any extra option you may want to add to the command (a --verbose flag for example). All options are listed here. | --verbose |
| Macro | Description | Default value | Mandatory |
|---|---|---|---|
| INCLUDE_STATUS | Filter by node status (can be a regexp). Status can be 'pending', 'running', 'succeeded', 'failed', 'unknown' | running | |
| EXCLUDE_STATUS | Exclude by node status (can be a regexp). Status can be 'pending', 'running', 'succeeded', 'failed', 'unknown' | ||
| EXCLUDE_NODE_NAME | Exclude by node name (can be a regexp) | ||
| WARNINGALLOCATEDPODS | Thresholds (in percentage) | ||
| CRITICALALLOCATEDPODS | Thresholds (in percentage) | ||
| WARNINGCPULIMITS | Thresholds (in percentage) | ||
| CRITICALCPULIMITS | Thresholds (in percentage) | ||
| WARNINGCPUREQUESTS | Thresholds (in percentage) | ||
| CRITICALCPUREQUESTS | Thresholds (in percentage) | ||
| WARNINGMEMORYLIMITS | Thresholds (in percentage) | ||
| CRITICALMEMORYLIMITS | Thresholds (in percentage) | ||
| WARNINGMEMORYREQUESTS | Thresholds (in percentage) | ||
| CRITICALMEMORYREQUESTS | Thresholds (in percentage) | ||
| EXTRAOPTIONS | Any extra option you may want to add to the command (a --verbose flag for example). All options are listed here. | --verbose |
| Macro | Description | Default value | Mandatory |
|---|---|---|---|
| FILTERPERSISTENTVOLUME | Filter persistent volume name (can be a regexp) | .* | |
| FILTERNAMESPACE | Filter persistent volume name (can be a regexp). | .* | |
| CRITICALSTATUS | Define the conditions to match for the status to be CRITICAL (default: '%{phase} !~ /Bound|Available|Released/i'). You can use the following variables: %{name}, %{phase} | %{phase} !~ /Bound|Available|Released/i | |
| WARNINGSTATUS | Define the conditions to match for the status to be WARNING (default: '') You can use the following variables: %{name}, %{phase} | ||
| EXTRAOPTIONS | Any extra option you may want to add to the command (a --verbose flag for example). All options are listed here. | --verbose |
| Macro | Description | Default value | Mandatory |
|---|---|---|---|
| FILTERPOD | Filter pod name (can be a regexp) | .* | |
| FILTERNAMESPACE | Filter pod namespace (can be a regexp) | .* | |
| UNITS | Units of thresholds (default: '%') ('%', 'count') | % | |
| WARNINGCONTAINERSREADY | Warning threshold | ||
| CRITICALCONTAINERSREADY | Critical threshold | ||
| CRITICALCONTAINERSTATUS | Define the conditions to match for the status to be CRITICAL (default: '%{status} !~ /running/i || %{state} !~ /^ready$/'). You can use the following variables: %{status}, %{state}, %{name} | %{status} !~ /running/i || %{state} !~ /^ready$/ | |
| WARNINGCONTAINERSTATUS | Define the conditions to match for the status to be WARNING (default: ''). You can use the following variables: %{status}, %{name} | ||
| CRITICALPODSTATUS | Define the conditions to match for the status to be CRITICAL (default: '%{status} !~ /running/i'). You can use the following variables: %{status}, %{name}, %{namespace} | %{status} !~ /running/i | |
| WARNINGPODSTATUS | Define the conditions to match for the status to be WARNING (default: ''). You can use the following variables: %{status}, %{name}, %{namespace} | ||
| WARNINGRESTARTSCOUNT | Warning threshold | ||
| CRITICALRESTARTSCOUNT | Critical threshold | ||
| WARNINGTOTALRESTARTSCOUNT | Warning threshold | ||
| CRITICALTOTALRESTARTSCOUNT | Critical threshold | ||
| EXTRAOPTIONS | Any extra option you may want to add to the command (a --verbose flag for example). All options are listed here. | --verbose |
| Macro | Description | Default value | Mandatory |
|---|---|---|---|
| FILTERREPLICATSET | Filter ReplicaSet name (can be a regexp) | .* | |
| FILTERNAMESPACE | Filter ReplicaSet namespace (can be a regexp) | .* | |
| CRITICALSTATUS | Define the conditions to match for the status to be CRITICAL (default: '%{ready} < %{desired}'). You can use the following variables: %{name}, %{namespace}, %{desired}, %{current}, %{ready} | %{ready} < %{desired} | |
| WARNINGSTATUS | Define the conditions to match for the status to be WARNING (default: '') You can use the following variables: %{name}, %{namespace}, %{desired}, %{current}, %{ready} | ||
| EXTRAOPTIONS | Any extra option you may want to add to the command (a --verbose flag for example). All options are listed here. | --verbose |
| Macro | Description | Default value | Mandatory |
|---|---|---|---|
| FILTERREPLICATIONCONTROLLER | Filter ReplicationController name (can be a regexp) | .* | |
| FILTERNAMESPACE | Filter ReplicationController namespace (can be a regexp) | .* | |
| CRITICALSTATUS | Define the conditions to match for the status to be CRITICAL (default: '%{ready} < %{desired}'). You can use the following variables: %{name}, %{namespace}, %{desired}, %{current}, %{ready} | %{ready} < %{desired} | |
| WARNINGSTATUS | Define the conditions to match for the status to be WARNING (default: '') You can use the following variables: %{name}, %{namespace}, %{desired}, %{current}, %{ready} | ||
| EXTRAOPTIONS | Any extra option you may want to add to the command (a --verbose flag for example). All options are listed here. | --verbose |
| Macro | Description | Valeur par défaut | Obligatoire |
|---|---|---|---|
| INCLUDE_NAME | Filter ResourceQuota name (can be a regexp) | ||
| EXCLUDE_NAME | Exclude ResourceQuota name (can be a regexp) | ||
| INCLUDE_NAMESPACE | Filter ResourceQuota namespace (can be a regexp) | ||
| EXCLUDE_NAMESPACE | Exclude ResourceQuota namespace (can be a regexp) | ||
| INCLUDE_RESOURCE | Filter ResourceQuota resource type (can be a regexp) | ||
| EXCLUDE_RESOURCE | Exclude ResourceQuota resource type (can be a regexp) | ||
| WARNING_USAGE | Define the conditions to match for the status to be WARNING. You can use the following variables: %{name}, %{namespace}, %{resource}, %{used}, %{hard}, %{usage_percent}, %{uid} | %{usage_percent} > 80 | |
| CRITICAL_USAGE | Define the conditions to match for the status to be CRITICAL. You can use the following variables: %{name}, %{namespace}, %{resource}, %{used}, %{hard}, %{usage_percent}, %{uid} | %{usage_percent} > 90 | |
| EXTRA_OPTIONS | Any extra option you may want to add to the command (a --verbose flag for example). All options are listed here. |
| Macro | Description | Default value | Mandatory |
|---|---|---|---|
| FILTERSTATEFULSET | Filter StatefulSet name (can be a regexp) | .* | |
| FILTERNAMESPACE | Filter StatefulSet namespace (can be a regexp) | .* | |
| WARNINGSTATUS | Define the conditions to match for the status to be WARNING (default: '%{up_to_date} < %{desired}') You can use the following variables: %{name}, %{namespace}, %{desired}, %{current}, %{up_to_date}, %{ready} | %{up_to_date} < %{desired} | |
| CRITICALSTATUS | Define the conditions to match for the status to be CRITICAL (default: '%{ready} < %{desired}'). You can use the following variables: %{name}, %{namespace}, %{desired}, %{current}, %{up_to_date}, %{ready} | %{ready} < %{desired} | |
| EXTRAOPTIONS | Any extra option you may want to add to the command (a --verbose flag for example). All options are listed here. | --verbose |
- Deploy the configuration. The service appears in the list of services, and on the Resources Status page. The command that is sent by the connector is displayed in the details panel of the service: it shows the values of the macros.
How to check in the CLI that the configuration is OK and what are the main options for?
Once the plugin is installed, log into your Centreon poller's CLI using the
centreon-engine user account (su - centreon-engine). Test that the connector
is able to monitor a resource using a command like this one (replace the sample values by yours):
/usr/lib/centreon/plugins/centreon_kubernetes_api.pl \
	--plugin=cloud::kubernetes::plugin \
	--mode=statefulset-status \
	--custommode='api' \
	--hostname= \
	--port='443' \
	--proto='https' \
	--token='' \
	--config-file='' \
	--proxyurl='' \
	--namespace='' \
	--timeout='10'  \
	--filter-name='.*' \
	--filter-namespace='.*' \
	--warning-status='%\{up_to_date\} < %\{desired\}' \
	--critical-status='%\{ready\} < %\{desired\}' \
	--verbose
The expected command output is shown below:
OK: All StatefulSets status are ok |
Troubleshooting
Here are some common errors and their description. You will often want to use
the --debug option to get the root error.
| Error | Description |
|---|---|
UNKNOWN: Cannot decode json response: Can't connect to <hostname>:<port> (certificate verify failed) | This error may appear if the TLS certificate is self-signed. Use the option --ssl-opt="SSL_verify_mode => SSL_VERIFY_NONE" to omit the certificate validity. |
UNKNOWN: API return error code '401' (add --debug option for detailed message) | If adding --debug option, API response message says Unauthorized. It generally means that the provided token is not valid. |
UNKNOWN: API return error code '403' (add --debug option for detailed message) | If adding --debug option, API response message says nodes is forbidden: User "system:serviceaccount:<namespace>:<account>" cannot list resource "nodes" in API group "" at the cluster scope. It means that the cluster role RBAC bound to the service account does not have the necessary privileges |
UNKNOWN: CLI return error code '1' (add --debug option for detailed message) | If adding --debug option, CLI response message says error: stat ~/.kube/config:: no such file or directory. The provided configuration file cannot be found. |
UNKNOWN: CLI return error code '1' (add --debug option for detailed message) | If adding --debug option, CLI response message says error: error loading config file "/root/.kube/config": open /root/.kube/config: permission denied. The provided configuration file cannot be read by current user. |
UNKNOWN: CLI return error code '1' (add --debug option for detailed message) | If adding --debug option, CLI response message says error: error loading config file "/root/.kube/config": v1.Config.AuthInfos: []v1.NamedAuthInfo: v1.NamedAuthInfo.AuthInfo: v1.AuthInfo.ClientKeyData: decode base64: illegal base64.... The provided configuration file is not valid. |
UNKNOWN: CLI return error code '1' (add --debug option for detailed message) | If adding --debug option, CLI response message says The connection to the server <hostname>:<port> was refused - did you specify the right host or port?. The provided configuration file is not valid. |
For more cases, please find the troubleshooting documentation for the API-based plugins in this chapter.
Available modes
In most cases, a mode corresponds to a service template. The mode appears in the execution command for the connector. In the Centreon interface, you don't need to specify a mode explicitly: its use is implied when you apply a service template. However, you will need to specify the correct mode for the template if you want to test the execution command for the connector in your terminal.
All available modes can be displayed by adding the --list-mode parameter to
the command:
/usr/lib/centreon/plugins/centreon_kubernetes_api.pl \
	--plugin=cloud::kubernetes::plugin \
	--list-mode
The plugin brings the following modes:
| Mode | Linked service template |
|---|---|
| cluster-events [code] | Cloud-Kubernetes-Cluster-Events-Api-custom |
| cronjob-status [code] | Cloud-Kubernetes-CronJob-Status-Api-custom |
| daemonset-status [code] | Cloud-Kubernetes-Daemonset-Status-Api-custom |
| deployment-status [code] | Cloud-Kubernetes-Deployment-Status-Api-custom |
| discovery [code] | Used for host discovery |
| list-cronjobs [code] | Used for service discovery |
| list-daemonsets [code] | Used for service discovery |
| list-deployments [code] | Used for service discovery |
| list-ingresses [code] | Not used in this Monitoring Connector |
| list-namespaces [code] | Not used in this Monitoring Connector |
| list-nodes [code] | Used for service discovery |
| list-persistentvolumes [code] | Used for service discovery |
| list-pods [code] | Used for service discovery |
| list-replicasets [code] | Used for service discovery |
| list-replicationcontrollers [code] | Used for service discovery |
| list-services [code] | Not used in this Monitoring Connector |
| list-statefulsets [code] | Used for service discovery |
| node-status [code] | Cloud-Kubernetes-Node-Status-Api-custom Cloud-Kubernetes-Node-Status-Name-Api-custom |
| node-usage [code] | Cloud-Kubernetes-Node-Usage-Api-custom Cloud-Kubernetes-Node-Usage-Name-Api-custom |
| persistentvolume-status [code] | Cloud-Kubernetes-PersistentVolume-Status-Api-custom |
| pod-status [code] | Cloud-Kubernetes-Pod-Status-Api-custom |
| replicaset-status [code] | Cloud-Kubernetes-ReplicaSet-Status-Api-custom |
| replicationcontroller-status [code] | Cloud-Kubernetes-ReplicationController-Status-Api-custom |
| resourcequota-status [code] | Cloud-Kubernetes-ResourceQuota-Status-Api-custom |
| statefulset-status [code] | Cloud-Kubernetes-StatefulSet-Status-Api-custom |
Available custom modes
This connector offers several ways to connect to the resource (CLI, library, etc.), called custom modes.
All available custom modes can be displayed by adding the --list-custommode parameter to
the command:
/usr/lib/centreon/plugins/centreon_kubernetes_api.pl \
	--plugin=cloud::kubernetes::plugin \
	--list-custommode
The plugin brings the following custom modes:
- api
- kubectl
Available options
Generic options
All generic options are listed here:
| Option | Description |
|---|---|
| --mode | Define the mode in which you want the plugin to be executed (see--list-mode). |
| --dyn-mode | Specify a mode with the module's path (advanced). |
| --list-mode | List all available modes. |
| --mode-version | Check minimal version of mode. If not, unknown error. |
| --version | Return the version of the plugin. |
| --custommode | When a plugin offers several ways (CLI, library, etc.) to get information the desired one must be defined with this option. |
| --list-custommode | List all available custom modes. |
| --multiple | Multiple custom mode objects. This may be required by some specific modes (advanced). |
| --pass-manager | Define the password manager you want to use. Supported managers are: environment, file, keepass, hashicorpvault and teampass. |
| --verbose | Display extended status information (long output). |
| --debug | Display debug messages. |
| --filter-perfdata | Filter perfdata that match the regexp. Example: adding --filter-perfdata='avg' will remove all metrics that do not contain 'avg' from performance data. |
| --filter-perfdata-adv | Filter perfdata based on a "if" condition using the following variables: label, value, unit, warning, critical, min, max. Variables must be written either %{variable} or %(variable). Example: adding --filter-perfdata-adv='not (%(value) == 0 and %(max) eq "")' will remove all metrics whose value equals 0 and that don't have a maximum value. |
| --explode-perfdata-max | Create a new metric for each metric that comes with a maximum limit. The new metric will be named identically with a '_max' suffix). Example: it will split 'used_prct'=26.93%;0:80;0:90;0;100 into 'used_prct'=26.93%;0:80;0:90;0;100 'used_prct_max'=100%;;;; |
| --change-perfdata --extend-perfdata | Change or extend perfdata. Syntax: --extend-perfdata=searchlabel,newlabel,target[,[newuom],[min],[m ax]] Common examples: Convert storage free perfdata into used: --change-perfdata='free,used,invert()' Convert storage free perfdata into used: --change-perfdata='used,free,invert()' Scale traffic values automatically: --change-perfdata='traffic,,scale(auto)' Scale traffic values in Mbps: --change-perfdata='traffic_in,,scale(Mbps),mbps' Change traffic values in percent: --change-perfdata='traffic_in,,percent()' |
| --extend-perfdata-group | Add new aggregated metrics (min, max, average or sum) for groups of metrics defined by a regex match on the metrics' names. Syntax: --extend-perfdata-group=regex,namesofnewmetrics,calculation[,[ne wuom],[min],[max]] regex: regular expression namesofnewmetrics: how the new metrics' names are composed (can use $1, $2... for groups defined by () in regex). calculation: how the values of the new metrics should be calculated newuom (optional): unit of measure for the new metrics min (optional): lowest value the metrics can reach max (optional): highest value the metrics can reach Common examples: Sum wrong packets from all interfaces (with interface need --units-errors=absolute): --extend-perfdata-group=',packets_wrong,sum(packets_(discard |error)_(in|out))' Sum traffic by interface: --extend-perfdata-group='traffic_in_(.*),traffic_$1,sum(traf fic_(in|out)_$1)' |
| --change-short-output --change-long-output | Modify the short/long output that is returned by the plugin. Syntax: --change-short-output=pattern |
| --change-exit | Replace an exit code with one of your choice. Example: adding --change-exit=unknown=critical will result in a CRITICAL state instead of an UNKNOWN state. |
| --range-perfdata | Rewrite the ranges displayed in the perfdata. Accepted values: 0: nothing is changed. 1: if the lower value of the range is equal to 0, it is removed. 2: remove the thresholds from the perfdata. |
| --filter-uom | Mask the units when they don't match the given regular expression. |
| --opt-exit | Replace the exit code in case of an execution error (i.e. wrong option provided, SSH connection refused, timeout, etc). Default: unknown. |
| --output-ignore-perfdata | Remove all the metrics from the service. The service will still have a status and an output. |
| --output-ignore-label | Remove the status label ("OK:", "WARNING:", "UNKNOWN:", CRITICAL:") from the beginning of the output. Example: 'OK: Ram Total:...' will become 'Ram Total:...' |
| --output-xml | Return the output in XML format (to send to an XML API). |
| --output-json | Return the output in JSON format (to send to a JSON API). |
| --output-openmetrics | Return the output in OpenMetrics format (to send to a tool expecting this format). |
| --output-file | Write output in file (can be combined with json, xml and openmetrics options). E.g.: --output-file=/tmp/output.txt will write the output in /tmp/output.txt. |
| --disco-format | Applies only to modes beginning with 'list-'. Returns the list of available macros to configure a service discovery rule (formatted in XML). |
| --disco-show | Applies only to modes beginning with 'list-'. Returns the list of discovered objects (formatted in XML) for service discovery. |
| --float-precision | Define the float precision for thresholds (default: 8). |
| --source-encoding | Define the character encoding of the response sent by the monitored resource Default: 'UTF-8'. Kubernetes CLI (kubectl) |
| --namespace | Set namespace to get informations. |
| --timeout | Set timeout in seconds (default: 10). |
| --proxyurl | Proxy URL if any |
Custom modes options
All custom modes specific options are listed here:
- api
- kubectl
| Option | Description |
|---|---|
| --hostname | Kubernetes API hostname. |
| --port | API port (default: 443) |
| --proto | Specify https if needed (default: 'https') |
| --timeout | Set HTTP timeout (default: 10). |
| --limit | Number of responses to return for each list calls. See https://kubernetes.io/docs/reference/kubernetes-api/common-param eters/common-parameters/#limit (fefault: 100) |
| --namespace | Set namespace to get information. |
| --legacy-api-beta | If this option is set the legacy API path are set for this API calls: kubernetes_list_cronjobs will use this path: /apis/batch/v1beta1/namespaces/ and kubernetes_list_ingresses will use this path: /apis/extensions/v1beta1/namespaces/ . This ways are no longer served since K8S 1.22 see https://kubernetes.io/docs/reference/using-api/deprecation-guide/#ingress-v122 |
| --http-peer-addr | Set the address you want to connect to. Useful if hostname is only a vhost, to avoid IP resolution. |
| --proxyurl | Proxy URL. Example: http://my.proxy:3128 |
| --proxypac | Proxy pac file (can be a URL or a local file). |
| --insecure | Accept insecure SSL connections. |
| --http-backend | Perl library to use for HTTP transactions. Possible values are: lwp (default) and curl. |
| --ssl-opt | Set SSL Options (--ssl-opt="SSL_version => TLSv1" --ssl-opt="SSL_verify_mode => SSL_VERIFY_NONE"). |
| --curl-opt | Set CURL Options (--curl-opt="CURLOPT_SSL_VERIFYPEER => 0" --curl-opt="CURLOPT_SSLVERSION => CURL_SSLVERSION_TLSv1_1" ). |
| Option | Description |
|---|---|
| --config-file | Kubernetes configuration file path (default: '~/.kube/config'). (example: --config-file='/root/.kube/config'). |
| --context | Context to use in configuration file. |
| --namespace | Set namespace to get informations. |
| --timeout | Set timeout in seconds (default: 10). |
| --sudo | Use 'sudo' to execute the command. |
| --command | Command to get information (default: 'kubectl'). Can be changed if you have output in a file. |
| --command-path | Command path (default: none). |
| --command-options | Command options (default: none). |
| --proxyurl | Proxy URL if any |
Modes options
All available options for each service template are listed below:
- Cluster-Events
- CronJob-Status
- Daemonset-Status
- Deployment-Status
- Node-Status*
- Node-Usage*
- PersistentVolume-Status
- Pod-Status
- ReplicaSet-Status
- ReplicationController-Status
- ResourceQuota-Status
- StatefulSet-Status
| Option | Description |
|---|---|
| --config-file | Kubernetes configuration file path (default: '~/.kube/config'). (example: --config-file='/root/.kube/config'). |
| --context | Context to use in configuration file. |
| --sudo | Use 'sudo' to execute the command. |
| --command | Command to get information (default: 'kubectl'). Can be changed if you have output in a file. |
| --command-path | Command path (default: none). |
| --command-options | Command options (default: none). |
| --filter-type | Filter event type (can be a regexp). |
| --filter-namespace | Filter namespace (can be a regexp). |
| --warning-status | Define the conditions to match for the status to be WARNING (default: '%{type} =~ /warning/i') Can use special variables like: %{name}, %{namespace}, %{type}, %{object}, %{message}, %{count}, %{first_seen}, %{last_seen}. |
| --critical-status | Define the conditions to match for the status to be CRITICAL (default: '%{type} =~ /error/i'). Can use special variables like: %{name}, %{namespace}, %{type}, %{object}, %{message}, %{count}, %{first_seen}, %{last_seen}. |
| Option | Description |
|---|---|
| --filter-name | Filter CronJob name (can be a regexp). |
| --filter-namespace | Filter CronJob namespace (can be a regexp). |
| --warning-status | Define the conditions to match for the status to be WARNING (default: '') You can use the following variables: %{name}, %{namespace}, %{active}, %{last_schedule}. |
| --critical-status | Define the conditions to match for the status to be CRITICAL (default: ''). You can use the following variables: %{name}, %{namespace}, %{active}, %{last_schedule}. |
| Option | Description |
|---|---|
| --include-name | Filter DaemonSet name (can be a regexp). |
| --exclude-name | Exclude DaemonSet name (can be a regexp). |
| --include-namespace | Filter DaemonSet namespace (can be a regexp). |
| --exclude-namespace | Exclude DaemonSet namespace (can be a regexp). |
| --warning-status | Define the conditions to match for the status to be WARNING (default: '%{up_to_date} < %{desired}') You can use the following variables: %{name}, %{namespace}, %{desired}, %{current}, %{available}, %{unavailable}, %{up_to_date}, %{ready}, %{misscheduled}. |
| --critical-status | Define the conditions to match for the status to be CRITICAL (default: '%{available} < %{desired}'). You can use the following variables: %{name}, %{namespace}, %{desired}, %{current}, %{available}, %{unavailable}, %{up_to_date}, %{ready}, %{misscheduled}. |
| Option | Description |
|---|---|
| --include-name | Filter deployment name (can be a regexp). |
| --exclude-name | Exclude deployment name (can be a regexp). |
| --include-namespace | Filter deployment namespace (can be a regexp). |
| --exclude-namespace | Exclude deployment namespace (can be a regexp). |
| --include-label | Include deployments matching the specified label filters. Filters are provided as a comma-separated list in the format key or key=value, where both key and value may be a regexp. |
| --exclude-label | Exclude deployments matching the specified label filters. Filters are provided as a comma-separated list in the format key or key=value, where both key and value may be a regexp. |
| --warning-status | Define the conditions to match for the status to be WARNING (default: '%{up_to_date} < %{desired}') You can use the following variables: %{name}, %{namespace}, %{desired}, %{current}, %{available}, %{unavailable}, %{up_to_date}. |
| --critical-status | Define the conditions to match for the status to be CRITICAL (default: '%{available} < %{desired}'). You can use the following variables: %{name}, %{namespace}, %{desired}, %{current}, %{available}, %{unavailable}, %{up_to_date}. |
| Option | Description |
|---|---|
| --filter-name | Filter node name (can be a regexp). |
| --warning-status | Define the conditions to match for the status to be WARNING (default: ''). You can use the following variables: %{type}, %{status}, %{reason}, %{message}, %{name}. |
| --critical-status | Define the conditions to match for the status to be CRITICAL (default: '(%{type} =~ /Ready/i && %{status} !~ /True/i) || (%{type} =~ /.*Pressure/i && %{status} !~ /False/i)'). You can use the following variables: %{type}, %{status}, %{reason}, %{message}, %{name}. |
| Option | Description |
|---|---|
| --filter-name | Filter node name (can be a regexp). |
| --warning-* --critical-* | Thresholds (in percentage). Can be: 'cpu-requests', 'cpu-limits', 'memory-requests', 'memory-limits', 'allocated-pods'. |
| Option | Description |
|---|---|
| --filter-name | Filter persistent volume name (can be a regexp). |
| --warning-status | Define the conditions to match for the status to be WARNING (default: '') You can use the following variables: %{name}, %{phase}. |
| --critical-status | Define the conditions to match for the status to be CRITICAL (default: '%{phase} !~ /Bound|Available|Released/i'). You can use the following variables: %{name}, %{phase}. |
| Option | Description |
|---|---|
| --filter-name | Filter pod name (can be a regexp). |
| --filter-namespace | Filter pod namespace (can be a regexp). |
| --extra-filter | Add an extra filter based on labels (can be defined multiple times) Example : --extra-filter='app=mynewapp' |
| --warning-pod-status | Define the conditions to match for the status to be WARNING (default: ''). You can use the following variables: %{status}, %{name}, %{namespace}. |
| --critical-pod-status | Define the conditions to match for the status to be CRITICAL (default: '%{status} !~ /running/i'). You can use the following variables: %{status}, %{name}, %{namespace}. |
| --warning-container-status | Define the conditions to match for the status to be WARNING (default: ''). You can use the following variables: %{status}, %{name}. |
| --critical-container-status | Define the conditions to match for the status to be CRITICAL (default: '%{status} !~ /running/i || %{state} !~ /^ready$/'). You can use the following variables: %{status}, %{state}, %{name}. |
| --warning-* | Warning threshold. Can be: 'containers-ready', 'total-restarts-count' (count), 'restarts-count' (count). |
| --critical-* | Critical threshold. Can be: 'containers-ready', 'total-restarts-count' (count), 'restarts-count' (count). |
| --units | Units of thresholds (default: '%') ('%', 'count'). |
| Option | Description |
|---|---|
| --filter-name | Filter ReplicaSet name (can be a regexp). |
| --filter-namespace | Filter ReplicaSet namespace (can be a regexp). |
| --warning-status | Define the conditions to match for the status to be WARNING (default: '') You can use the following variables: %{name}, %{namespace}, %{desired}, %{current}, %{ready}. |
| --critical-status | Define the conditions to match for the status to be CRITICAL (default: '%{ready} < %{desired}'). You can use the following variables: %{name}, %{namespace}, %{desired}, %{current}, %{ready}. |
| Option | Description |
|---|---|
| --filter-name | Filter ReplicationController name (can be a regexp). |
| --filter-namespace | Filter ReplicationController namespace (can be a regexp). |
| --warning-status | Define the conditions to match for the status to be WARNING (default: '') You can use the following variables: %{name}, %{namespace}, %{desired}, %{current}, %{ready}. |
| --critical-status | Define the conditions to match for the status to be CRITICAL (default: '%{ready} < %{desired}'). You can use the following variables: %{name}, %{namespace}, %{desired}, %{current}, %{ready}. |
| Option | Description |
|---|---|
| --filter-counters | Only display some counters (regexp can be used). Example to check SSL connections only : --filter-counters='^xxxx|yyyy$' |
| --warning-xxx | Warning threshold. |
| --critical-xxx | Critical threshold. |
| --include-name | Filter ResourceQuota name (can be a regexp). |
| --exclude-name | Exclude ResourceQuota name (can be a regexp). |
| --include-namespace | Filter ResourceQuota namespace (can be a regexp). |
| --exclude-namespace | Exclude ResourceQuota namespace (can be a regexp). |
| --include-resource | Filter ResourceQuota resource type (can be a regexp). |
| --exclude-resource | Exclude ResourceQuota resource type (can be a regexp). |
| --warning-usage | Define the conditions to match for the status to be WARNING (default: '%{usage_percent} > 80'). You can use the following variables: %{name}, %{namespace}, %{resource}, %{used}, %{hard}, %{usage_percent}, %{uid}. |
| --critical-usage | Define the conditions to match for the status to be CRITICAL (default: '%{usage_percent} > 90'). You can use the following variables: %{name}, %{namespace}, %{resource}, %{used}, %{hard}, %{usage_percent}, %{uid}. |
| Option | Description |
|---|---|
| --filter-name | Filter StatefulSet name (can be a regexp). |
| --filter-namespace | Filter StatefulSet namespace (can be a regexp). |
| --warning-status | Define the conditions to match for the status to be WARNING (default: '%{up_to_date} < %{desired}') You can use the following variables: %{name}, %{namespace}, %{desired}, %{current}, %{up_to_date}, %{ready}. |
| --critical-status | Define the conditions to match for the status to be CRITICAL (default: '%{ready} < %{desired}'). You can use the following variables: %{name}, %{namespace}, %{desired}, %{current}, %{up_to_date}, %{ready}. |
All available options for a given mode can be displayed by adding the
--help parameter to the command:
/usr/lib/centreon/plugins/centreon_kubernetes_api.pl \
	--plugin=cloud::kubernetes::plugin \
	--mode=statefulset-status \
	--custommode='api' \
	--help