Report Business Activities
You can view history data at any time on the reporting and log screens, and on performance graphs. These screens are similar to those used on the Centreon server.
Reporting
The reporting page is in the Reporting > Availability menu in Centreon. Select a BA to display operational availability, warning and critical statistics for a given period:
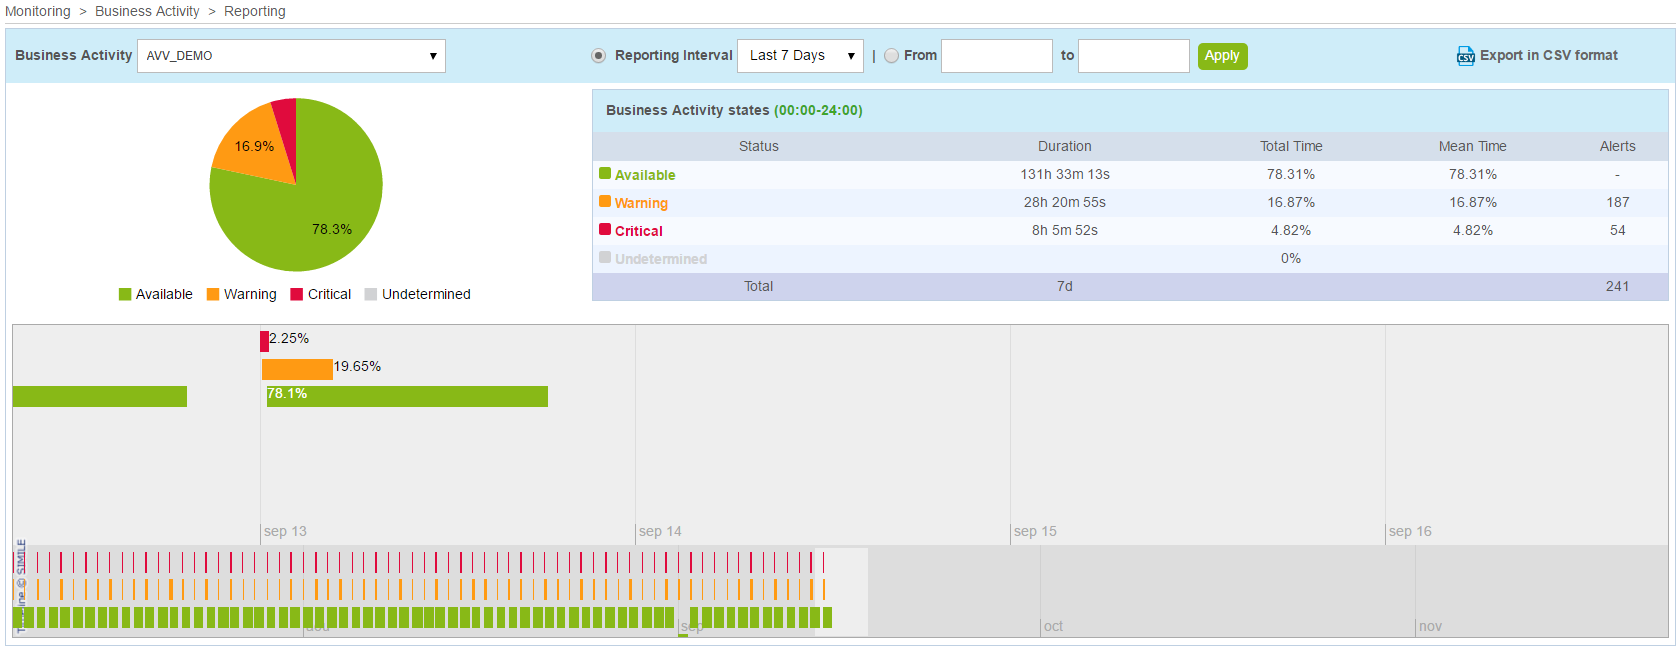
You can export the data to a .csv file by clicking the Export in CSV format link.
Force statistics calculation
Events & availability statistics are automatically calculated daily. In case you modify the default reporting period, add an extra one or change BV association, you may need to rebuild the previously calculated data.
To do so, run the following script:
/usr/share/centreon/www/modules/centreon-bam-server/engine/centreon-bam-rebuild-events --all
It is also possible to rebuild a specific BA:
/usr/share/centreon/www/modules/centreon-bam-server/engine/centreon-bam-rebuild-events --ba=<id of ba>
For more information regarding this script, run the following command:
/usr/share/centreon/www/modules/centreon-bam-server/engine/centreon-bam-rebuild-events --help
If you are also using Centreon MBI and wish to use the updated data, run the following command on the reporting server:
/usr/share/centreon-bi/etl/importData.pl -r --bam-only