Monitor a MySQL or MariaDB database
The objective of this tutorial is to monitor a Mysql/MariaDB database.
Prerequisites
On the database your want to monitor
In order to be able to collect the necessary information from the database, a database user with specific privileges is required. If the database you want to monitor is a Centreon database, a dedicated user already exists and is called centreon. Otherwise, start by creating a new user: log in to your database, then run the following command:
CREATE USER 'username'@'IP_POLLER' IDENTIFIED BY 'password';
Then, whether your database is a Centreon database or not, run the following command:
GRANT SELECT ON *.* TO 'username'@'IP_POLLER';
Replace the username, the IP address of the poller and the password by the values you want.
On the poller
Install the following plugin on the poller that will monitor your database:
- Alma / RHEL / Oracle Linux 8
- Alma / RHEL / Oracle Linux 9
- Debian 11
dnf install centreon-plugin-Applications-Databases-Mysql
dnf install centreon-plugin-Applications-Databases-Mysql
apt install centreon-plugin-applications-databases-mysql
On the central server
The database will be monitored using the MySQL/MariaDB Monitoring Connector. Go to the menu Configuration > Monitoring Connector Manager and install the MySQL/MariaDB Monitoring Connector:
Set up the host and deploy the configuration
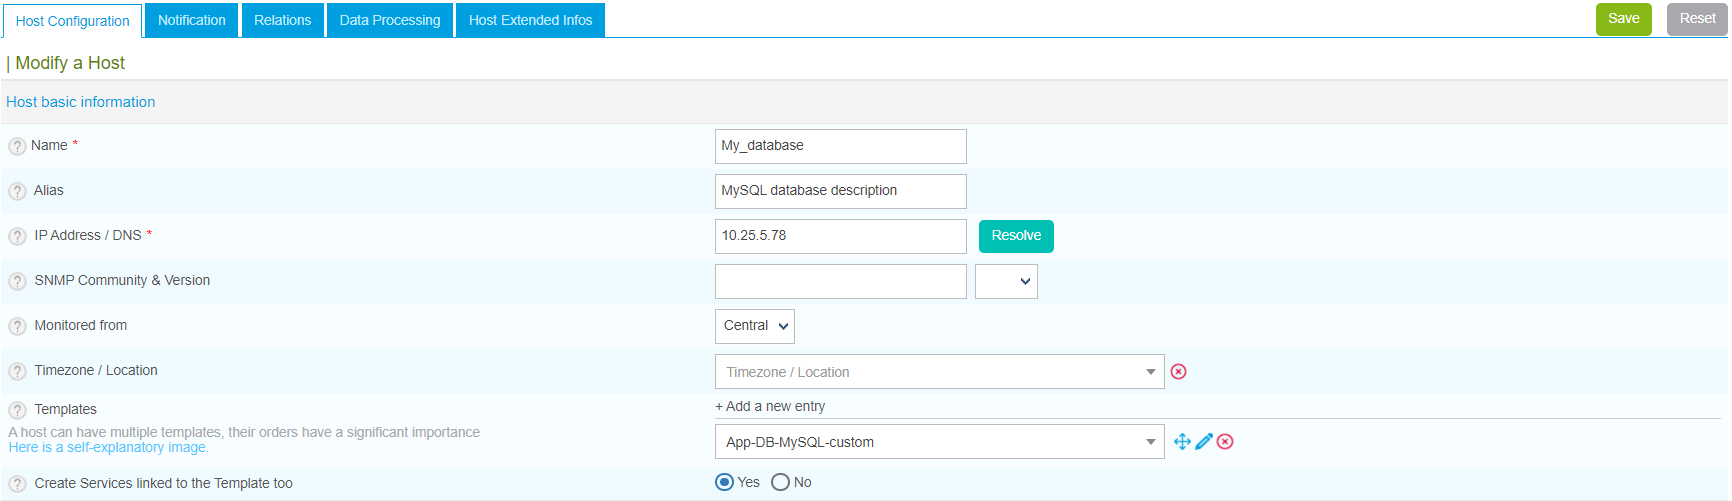
Go to Configuration > Hosts > Hosts and click on Add:
Fill in the following information:
- The name of your server
- A description of your server
- Its IP address
- Select the poller that will monitor the database (leave "Central" if you have no other poller)
Click on the + Add New Entry button for the Templates field and select the App-DB-MySQL-custom template:
A list of macros matching the template will appear:
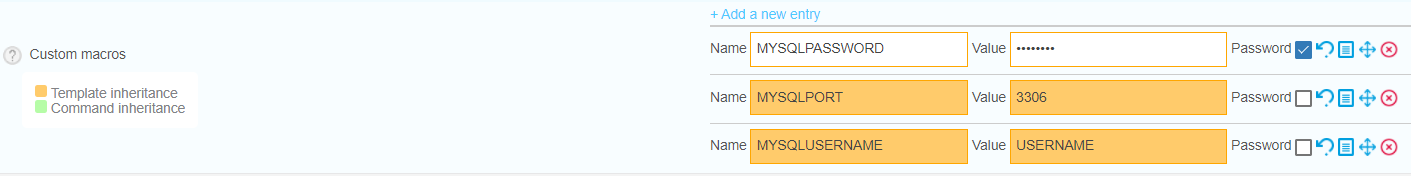
Fill in the value of following macros:
- MYSQLUSERNAME: the name of the user that will connect to the database.
- MySQLPASSWORD: the password associated with this user.
- MySQLPORT: the listening port of the database, by default 3306.
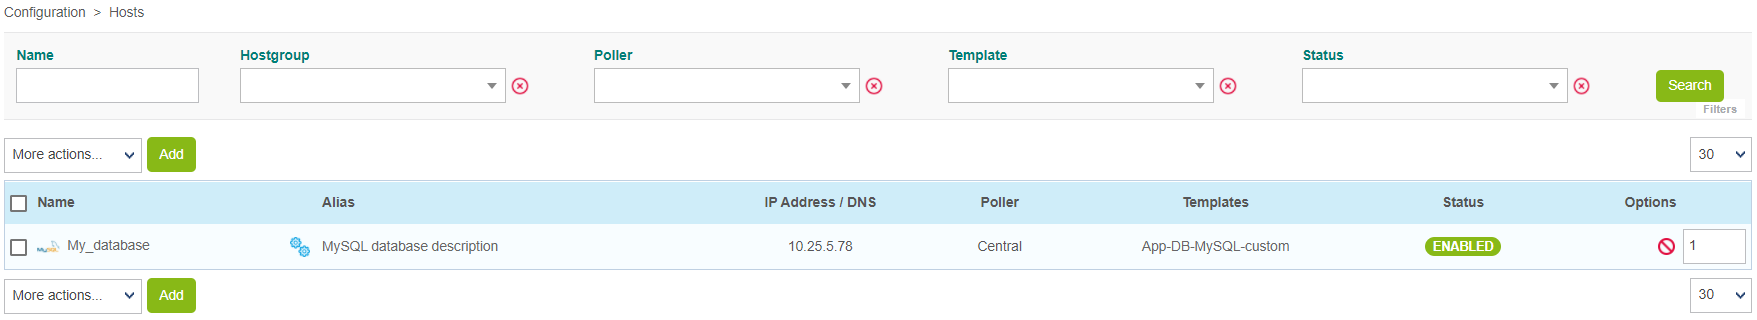
Click on Save. Your equipment has been added to the list of hosts:
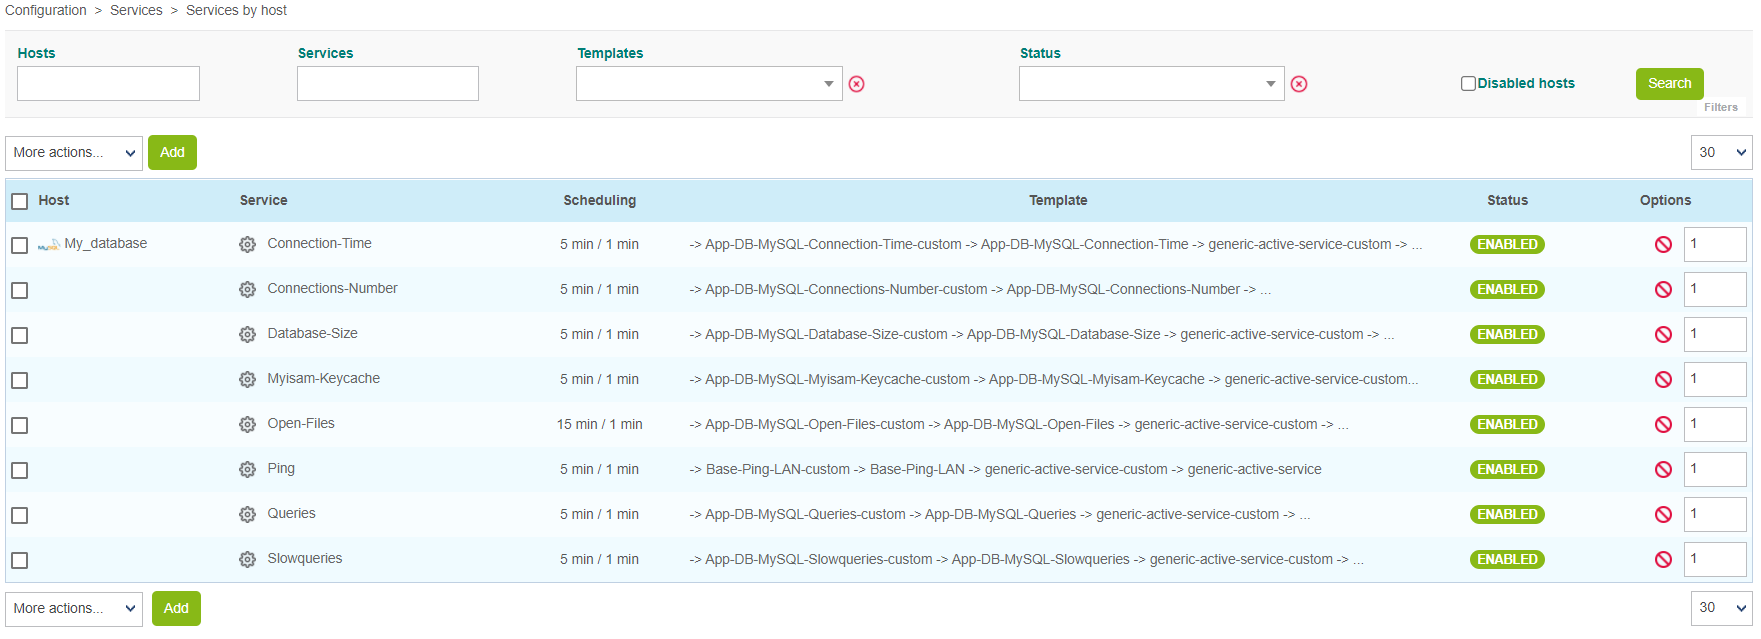
Go to Configuration > Services > Services by host. A set of indicators has been deployed automatically:
Go to Monitoring > Status Details > Services and select All for the Service Status filter. At first, the resources appear with the status Pending, which means that no checks have been executed yet. After a few minutes, the first results of the monitoring appear: