Monitor your first Cisco router
Monitoring a Cisco Router with SNMP
In this tutorial, we're assuming that your Centreon platform is installed and running well, and that you have at least a Centreon IT 100 Edition that provides Centreon Plugin Packs (your license is already set up).
Your Cisco router will be monitored using the Cisco standard plugin pack. (More about Plugin Packs here).
Prerequisites
On the Cisco router you want to monitor
The first step is to activate and configure an SNMP service on your Cisco device. Please refer to the documentation of your Cisco device to know how to configure the SNMP service. The monitoring procedure for the Cisco standard plugin pack includes an example.
Network flow
The target device must be reachable from the Centreon Poller on the UDP/161 SNMP port.
On the poller
Connect to your poller using SSH and install the Cisco standard plugin (see the monitoring procedure for the Cisco standard Plugin Pack for more information):
yum install centreon-plugin-Network-Cisco-Standard-Snmp
On the central server
In the web interface, go to Configuration > Plugin Packs, search for the Cisco standard Plugin Pack and install it:
Configure the host and deploy the configuration
Go to the Configuration > Hosts > Hosts menu and click on Add:
Fill in the following information:
- The name of the router (1)
- A description of the router (2)
- The IP address of the router (3)
- The SNMP version and community (4)
- Select the poller that will monitor the device (keep "Central" if you have no other poller) (5)
Click on + Add a new entry in the Templates field (6), then select the Net-Cisco-Standard-SNMP-custom template (7) from the list:
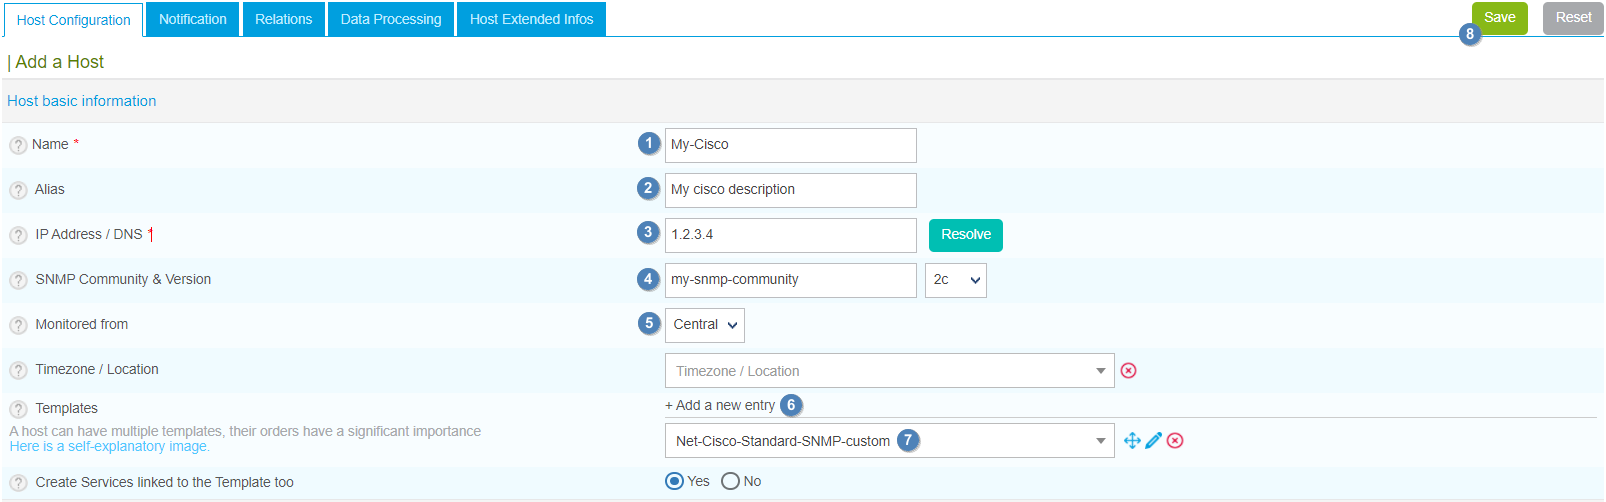
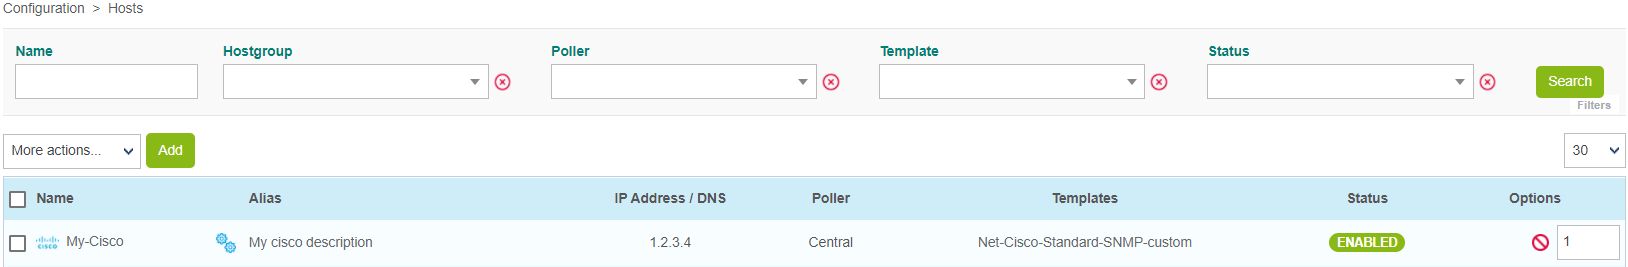
Click on Save (8). Your equipment has been added to the list of hosts:
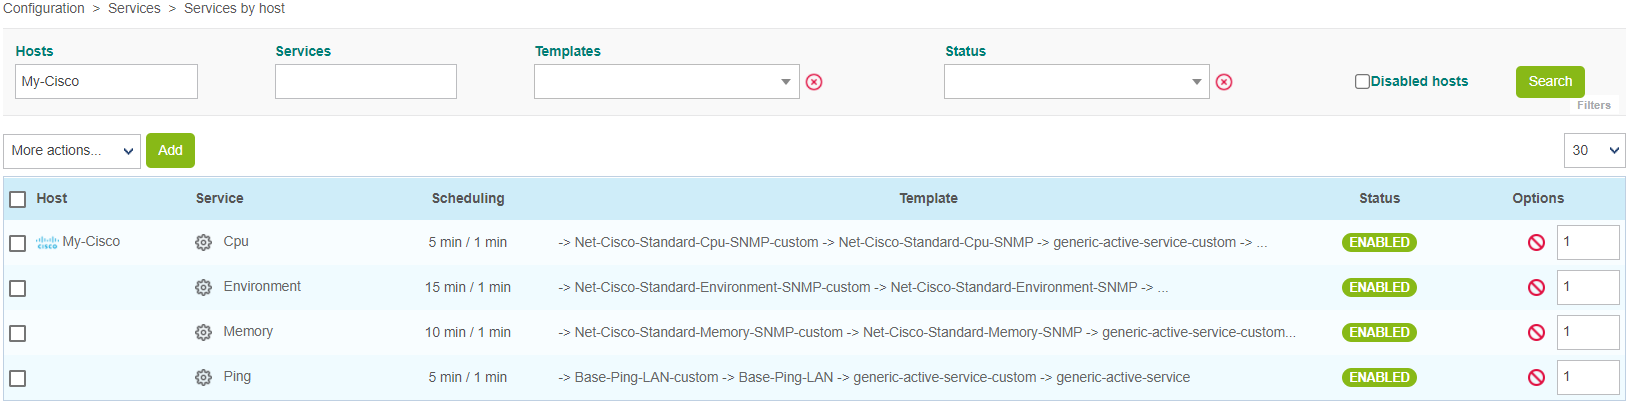
Go to Configuration > Services > Services by host. A set of indicators has been created automatically.

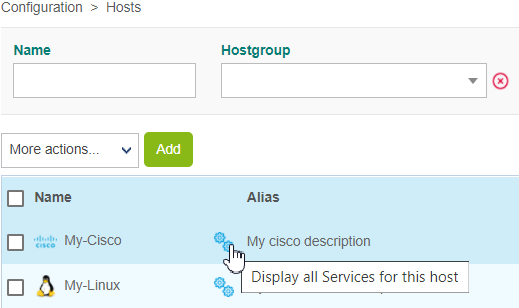
You can also use the shortcut beside the host's name to go directly to Configuration > Services > Services by host. The list will be filtered by the name of the host:
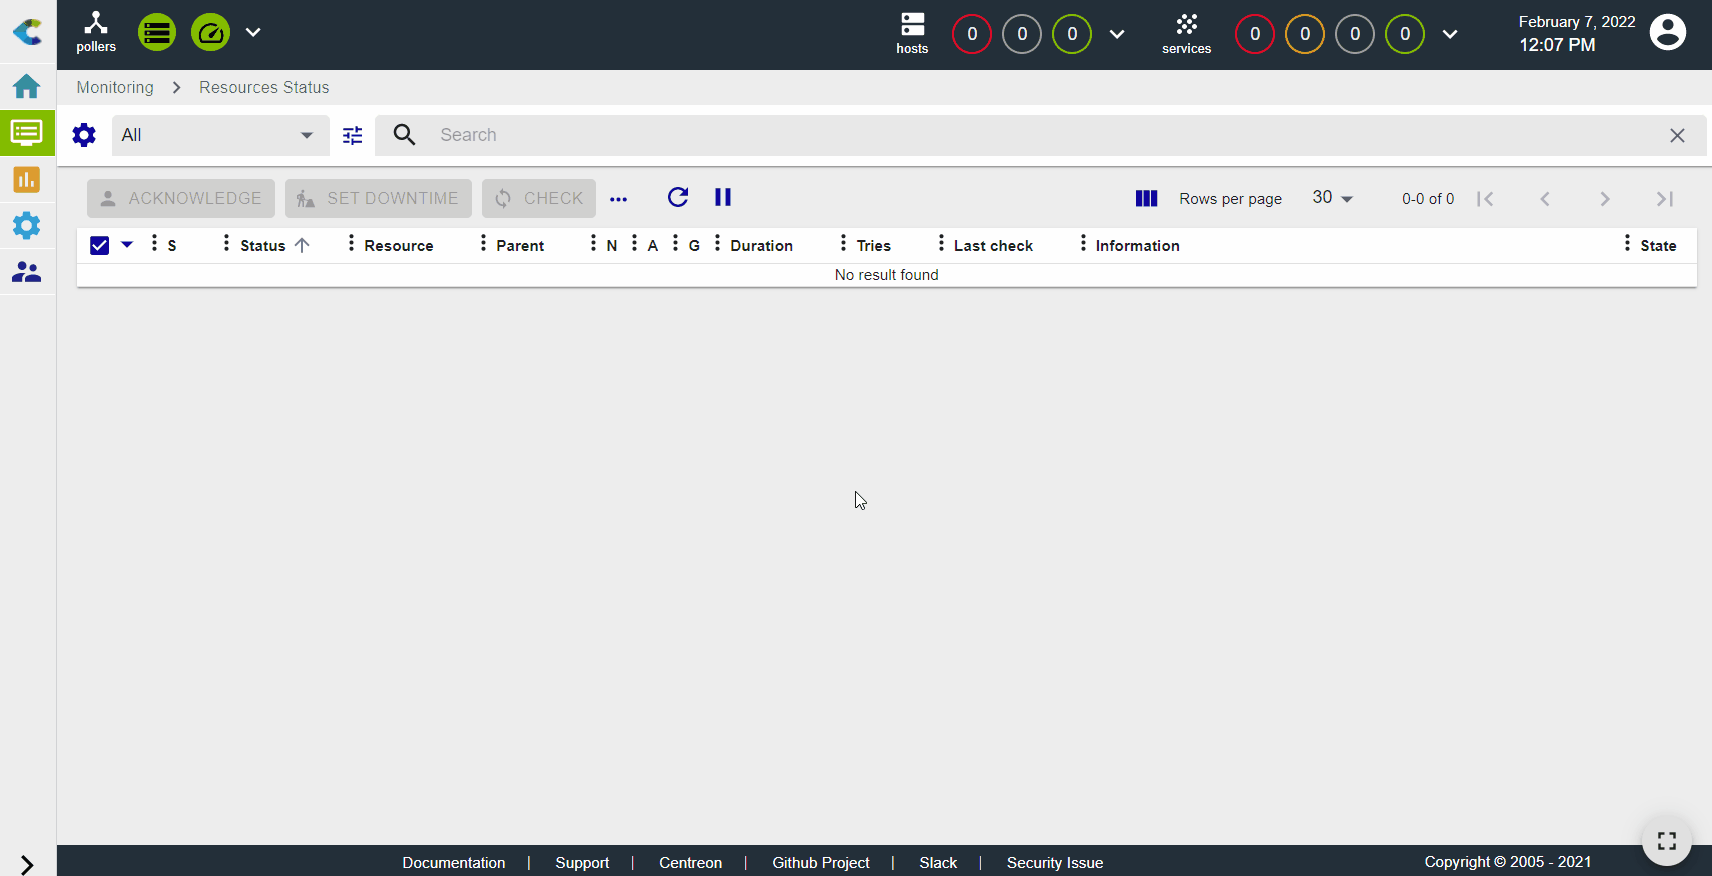
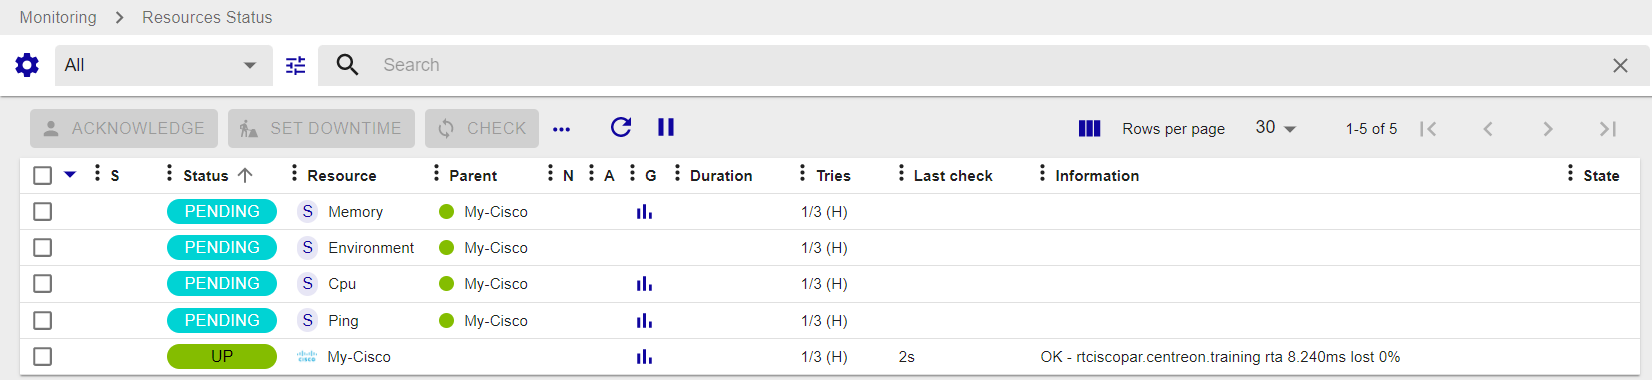
Go to Monitoring > Resources Status and select All from the Resource status filter. At first, the resources appear with the status Pending, which means that no checks have been executed yet:
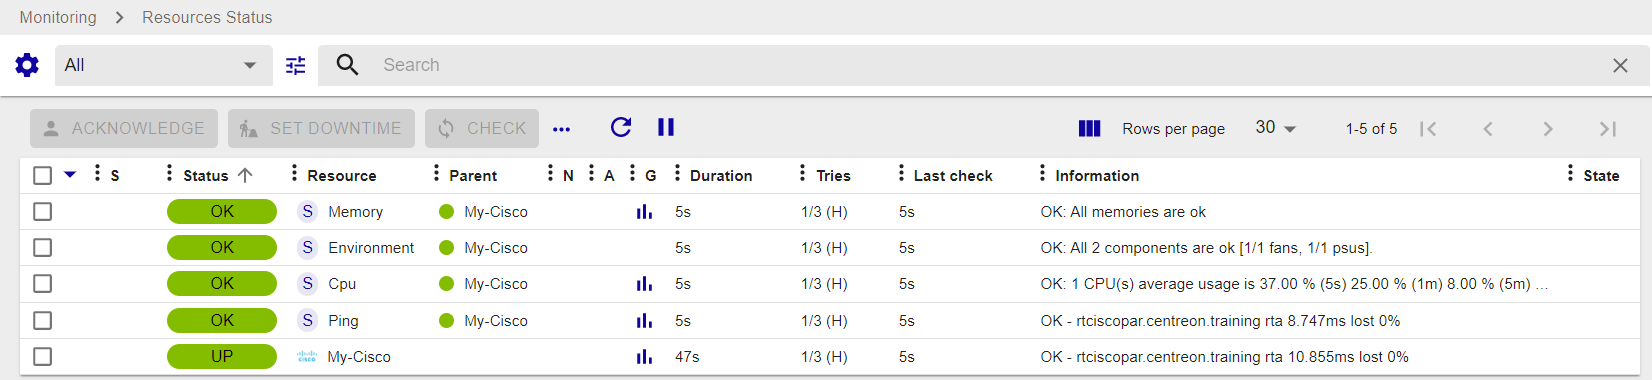
After a few minutes, the first results of the monitoring appear:
If not all services are in an OK state, check what causes the error and fix the problem.