Anomaly detection
Centreon Anomaly Detection is a Centreon extension that requires a valid license. To purchase one and retrieve the necessary repositories and access token, contact Centreon.
Description
The Centreon Anomaly Detection module detects deviations from the regular behavior of a service: it uses dynamic thresholds to trigger alerts.
With "classic" monitoring, alerts are triggered from static thresholds: for instance, users are alerted when the ping on a server exceeds 700 ms. However, for some services, "normal" values change over time, which means that static thresholds are not that relevant. You can use Anomaly Detection when the behavior of a service is repetitive and predictable:
Anomaly Detection determines how the normal values evolve in time: predictions calculate a lower threshold and an upper threshold. When the behavior of the service deviates from the expected model, these thresholds are passed (i.e. the metric goes below the lower threshold or goes over the upper threshold). The service goes into a CRITICAL state and a notification is sent. Exemple: a server usually has little traffic at night. One night, Centreon detects network flows higher than normal and triggers an alert. This makes the company aware that the server has been hacked.
How it works
Collected data is sent to the Centreon SaaS platform.
Centreon computes a regular behavior model thanks to the history of this data.
Once the model has been calculated, predictions are then generated and retrieved by your Centreon platform.
The predictions act as floating thresholds which will then be used by the monitoring engine to compare the collected value with the predicted thresholds to highlight deviations and generate alerts. Data received during downtimes are not taken into account when computing predictions so as not to distort the analysis.
Models are recomputed regularly and improve over time.
Prerequisites
To use Anomaly Detection, you will need:
A token provided by Centreon to access the Centreon SaaS platform,
An internet connection from the Centreon central server. The central server must be able to reach
api.a.prod.mycentreon.comon port 443.The SHELL environment variable LC_ALL must not be set, or be set to
C. To check the value of this variable, enter:echo $LC_ALL
Installation
Step 1: Installing packages
- Add an additional repository:
- Alma / RHEL / Oracle Linux 8
- CentOS 7
Nothing to do.
yum install -y epel-release
Run the following command:
yum install centreon-anomaly-detection
Step 2: UI installation
Go to Administration > Extensions > Manager. An Anomaly Detection tile appears in the Modules section.
Click on the installation button in the Anomaly Detection tile. The module is now installed (the version number appears on a green background with a white check mark next to it).
Run the following command as a privileged user:
systemctl restart gorgoned
Step 3: Add your token
Go to Configuration > Services > Anomaly Detection and click on Add Centreon Cloud Token.
Enter your token and click on Save.
If your Centreon central server needs a proxy configuration to access the Internet, check the Use proxy box.
Your Centreon platform is now ready to use Centreon Anomaly Detection.
Configuration
To have a fully functional Anomaly Detection service, you need to go through 4 steps:
- Create an Anomaly Detection service. This will activate the sending of the collected data to the Centreon SaaS platform, in order to start modeling regular behavior.
- Assess the relevance of the computed predictions.
- Once the model seems right, activate status changes for the service.
- When all changes in status seem relevant, activate the notification process.
Step 1: Create an Anomaly Detection service
You can create an Anomaly Detection service manually, or use the creation wizard. To create an Anomaly Detection service manually:
Go to Configuration > Services > Anomaly Detection and click on Create manually:
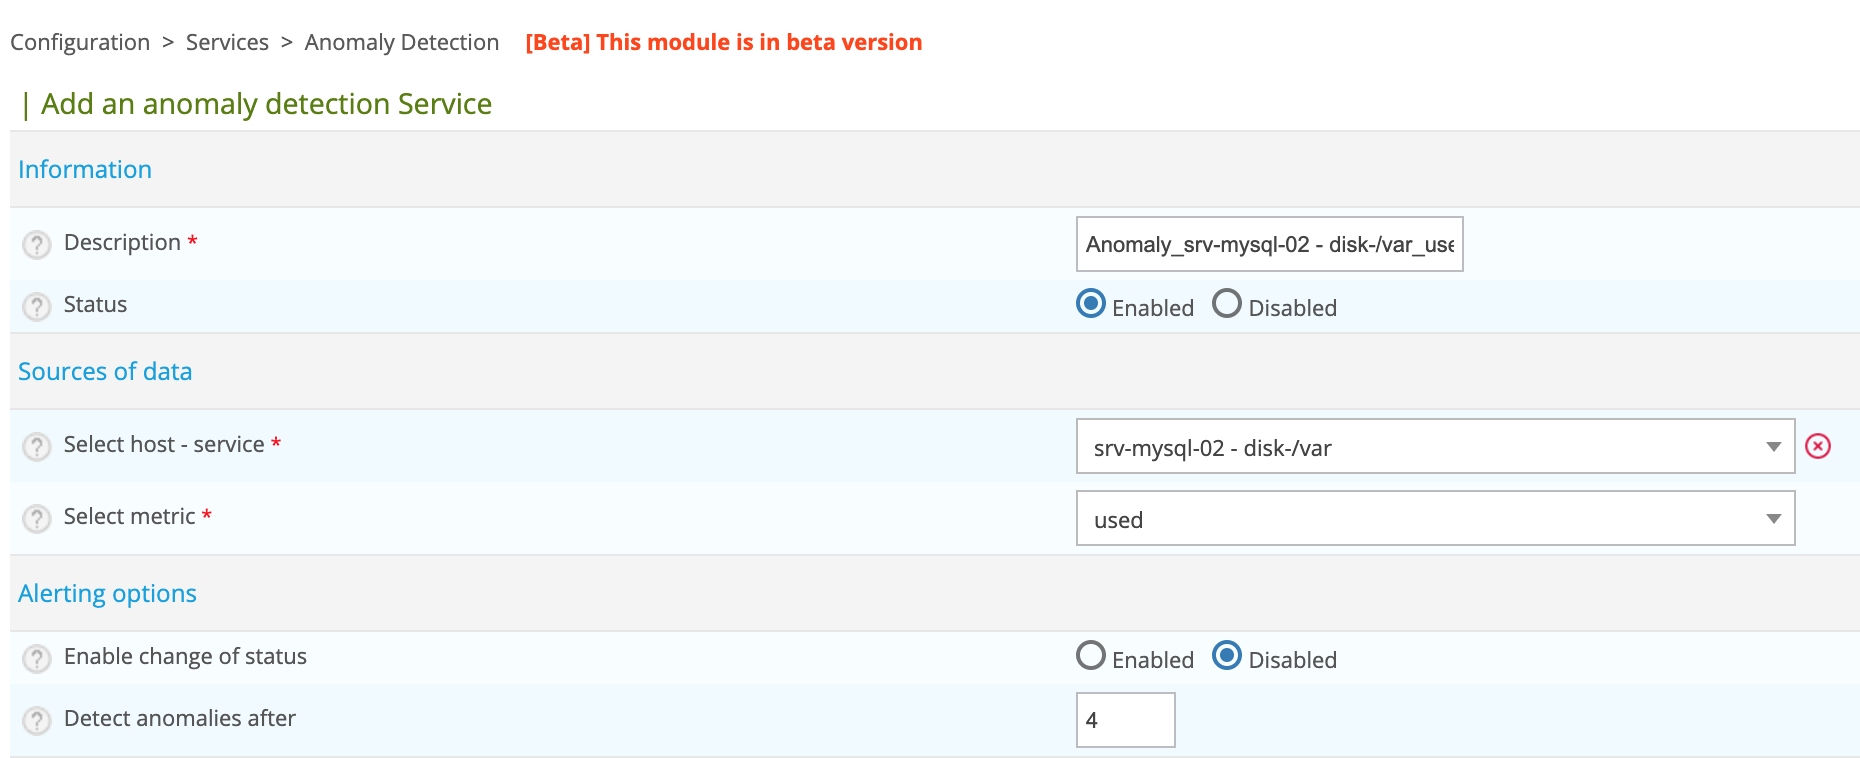
Fill in the following fields:
- Description: the name of the service. The following characters are not authorized:
~!$%^&|'"<>?,()=*{}and spaces. - Status: enable or disable the service. If you disable the service, after you deploy the configuration, the service will no longer be monitored (for instance it won't appear on page Resources Status anymore).
- Select host - service: choose the host/service couple on which the Anomaly Detection service will be based.
- Select metric: select the metric on which to apply anomaly detection.
- For the time being, leave the Enable change of status and Enable notifications fields set to Disabled (they will be enabled at step 3 and 4).
- In section Categories and groups, you can set a severity level.
Click on Save.
The service appears on page Monitoring > Resources Status. To display only Anomaly Detection services, use the Type filter in the Filter options window.
The behavior model calculation starts. However, before calculations have been made and predictions sent to your platform, the status of the service is UNKNOWN. For predictions to be computes, you need to have at least 4 hours' worth of data.
The first predictions will appear in up to 36 hours. The service will then be in an OK status, until status changes are enabled (step 3).
If the data on which you apply the anomaly detection has been supervised for a certain time, it is possible to transfer the data history to obtain a reliable model more quickly.
Step 2: Assess the relevance of the predictions
At first, the predictions you receive will not be very relevant: Anomaly Detection needs to identify several repetitions of data patterns before it can compute a correct model. This means that the length of time needed to compute the model varies according to how often your data repeats (daily, weekly...). In general, you will need to wait for about 6 weeks to obtain a stable model.
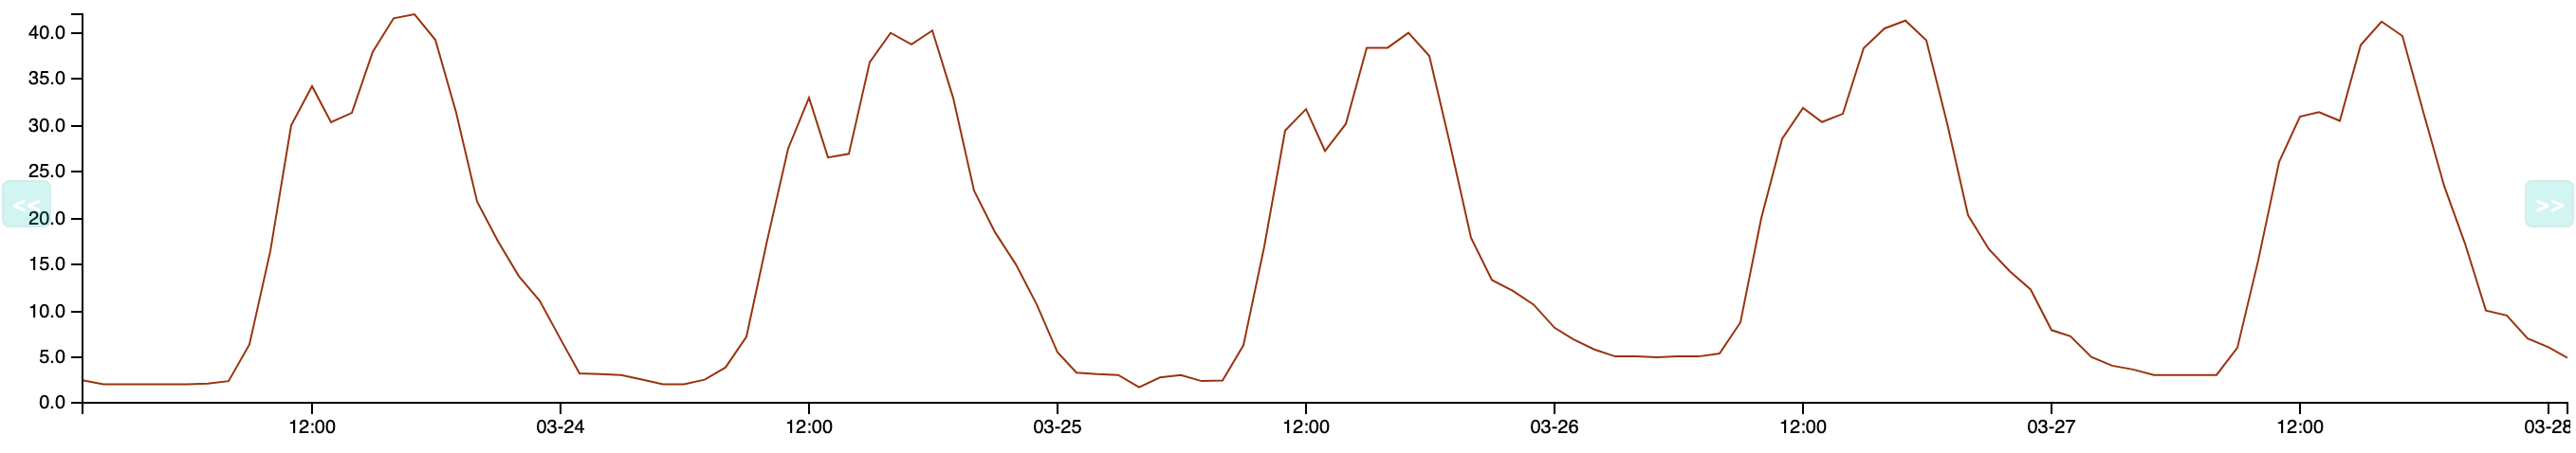
To assess the relevance of the predictions, look at the service's graph on page Monitoring > Performances > Graphs, or on the Graphs tab of the details panel for the service on page Monitoring > Resources Status.
If you think this is necessary (e.g if you see too many false positives, or on the contrary if the predictions do not detect enough incidents), you can manually adjust the distance between the curve and the thresholds.
- On page Monitoring > Resources Status, click on the Anomaly Detection service you want, then click the Graph tab in the details panel.
- Click the Edit anomaly detection data icon (the wrench) at the top right of the tab. The graph opens in a pop-up window.
- Use the slider in section Manage envelope size to change the range of the predictions: in the preview, checks outside the envelope are shown by red dots.
- Click on Save. The new envelope size is applied from that moment on. The envelope that was already calculated stays the same (this means that the changes are not visible immediately on the graph).
Step 3: Activate status changes
If, by regularly following the generated model and the data from the Monitoring > Performances > Graphs menu, you think that your model is stable, you can activate status changes. Once you enable this option the status of the service will switch to CRITICAL SOFT as soon as the metric goes below the lower threshold or goes above the upper threshold.
Go to the Configuration > Services > Anomaly Detection menu and click the Anomaly Detection service you want.
In the Alerting options section, enable the Enable change of status option.
In the Detect anomalies after field, enter the number of deviations before the service switches to a CRITICAL HARD state. (When enabled, notifications are only sent when the service switches from SOFT to HARD.)
Click on Save.
Activate the notification process
When you are satisfied that the status changes you see are relevant (they do happen when an incident starts or finishes), then your Anomaly Detection service is fully operational. You can then activate the notifications.
Go to Configuration > Services > Anomaly Detection and click on the Anomaly Detection service you want.
Fill in the following fields:
- Enable notification: select Enabled.
- Implied Contacts: select who will receive notifications for this service.
- Implied Contact Groups: select the contact groups that will receive notifications for this service.
- Notification Interval: define how frequently notifications should be sent once the service has entered a CRITICAL HARD state and has not been acknowledged yet. The default value is 0, which means only one notification will be sent per status change.
- Notification Period: select the time period during which these users may receive notifications.
- Notification Type: select the types of notifications you want to receive (when the service enters a CRITICAL state and/or when it goes back to normal).
Click on Save.
Use the creation wizard
The creation wizard makes it possible to highlight the services that follow patterns or have a regular stability (for which values are consistently included between two thresholds).
Go to Configuration > Services > Anomaly Detection and click on Create from analysis.
The list of existing services on your Centreon platform is displayed as well as a score in number of stars: from 5 stars to 0, 5 stars representing high potential services:
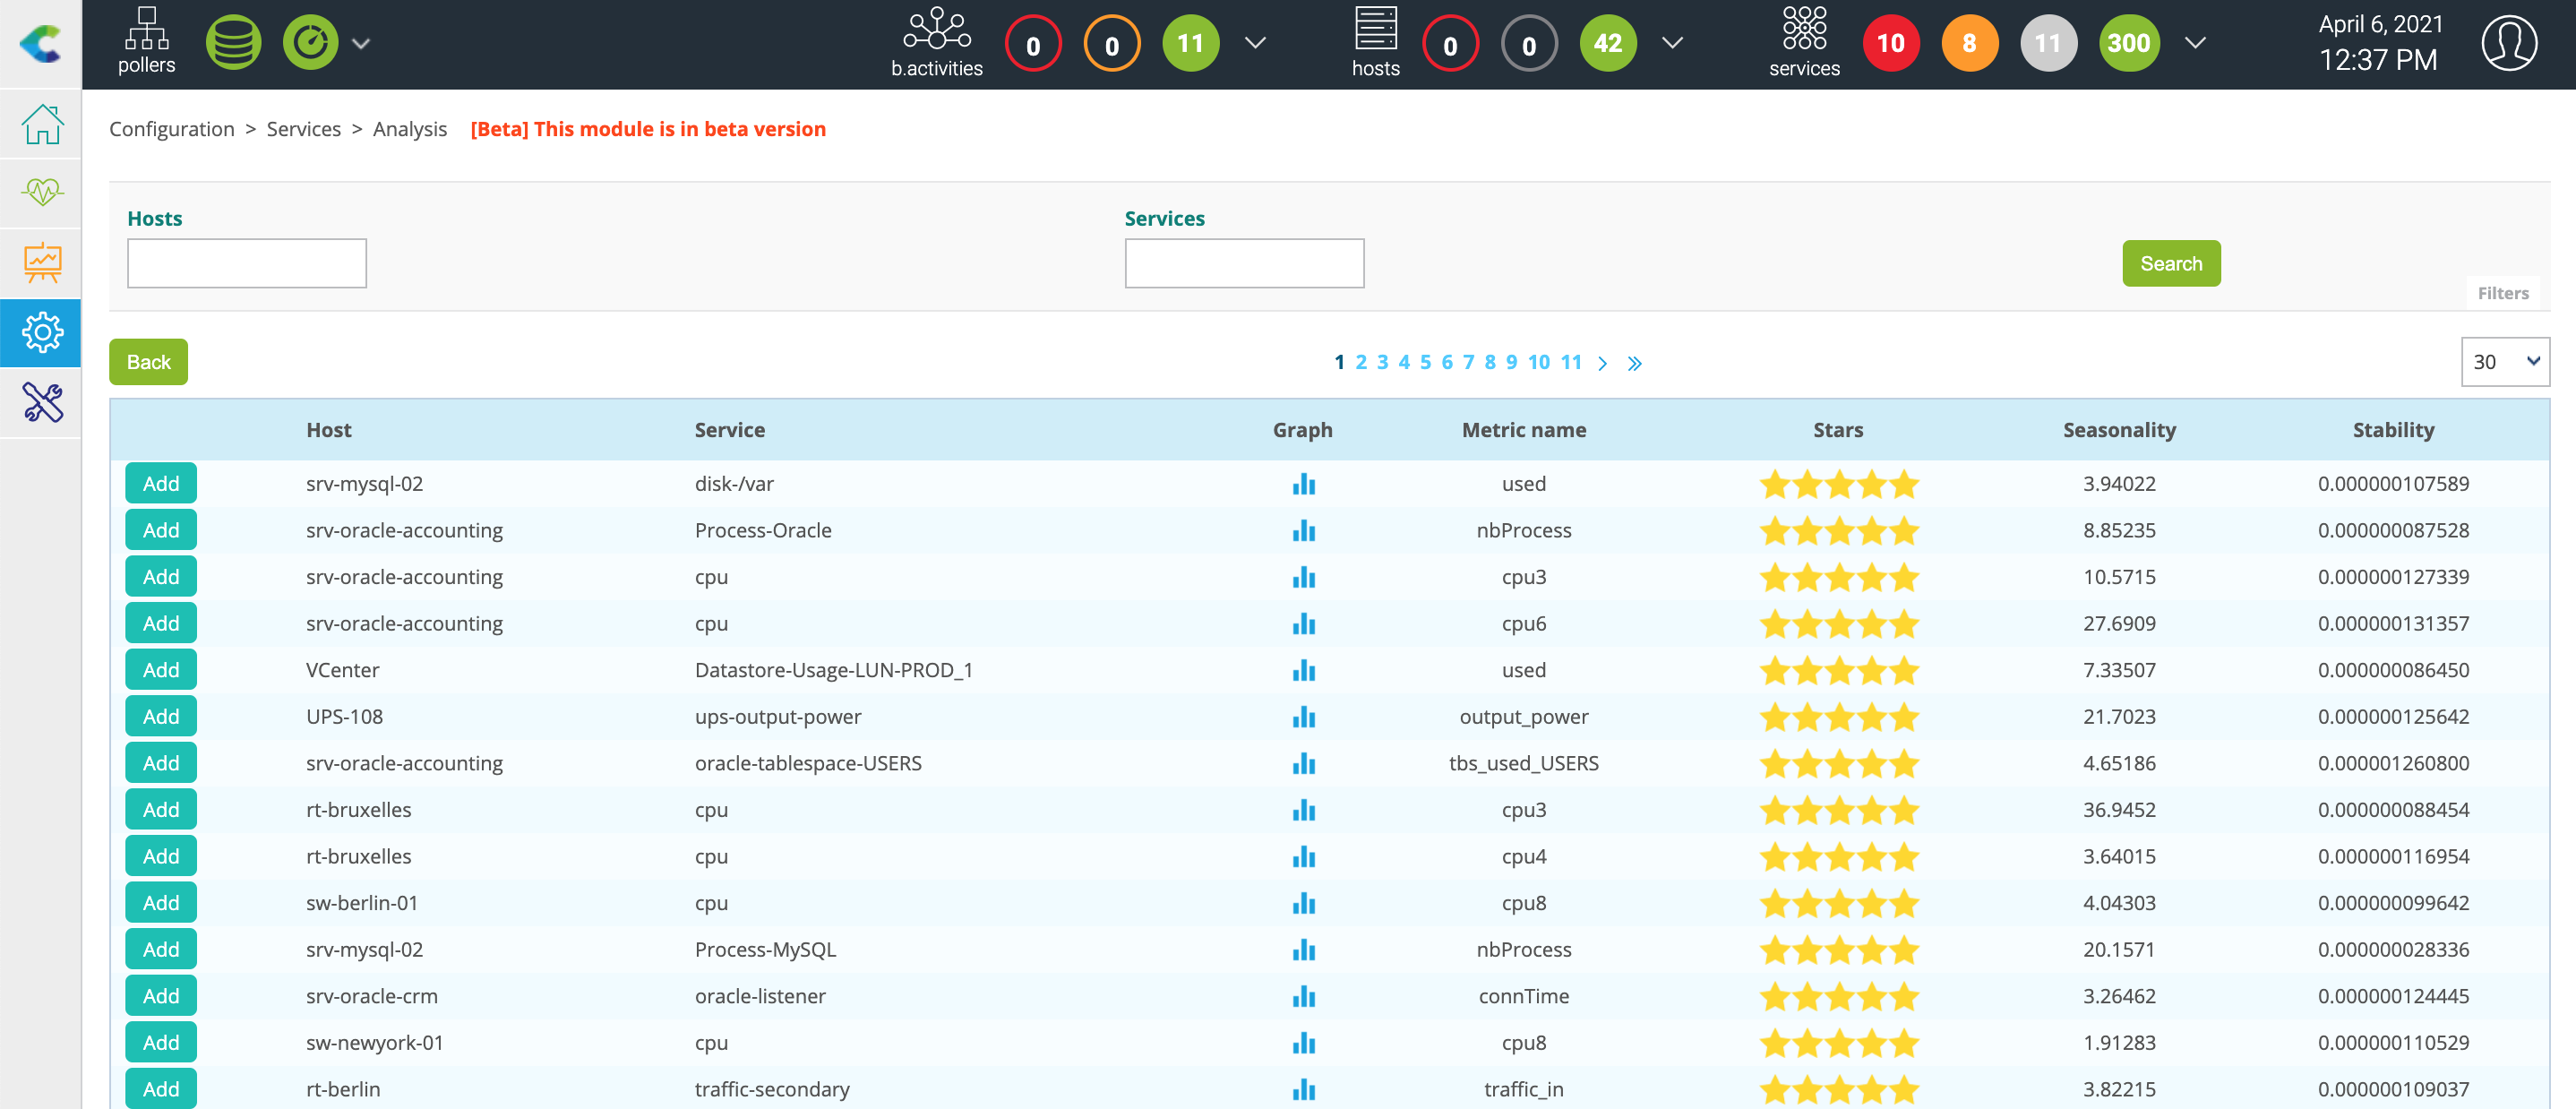
After selecting an interesting service, click on the ADD button to the left of the row. You arrive on the pre-filled creation form:
Modify the name of the service then click on the Save button.
If the list is empty, it means that the calculation to determine which services are interesting has not yet started.
This is done every 6 hours via a cron launched by the gorgoned process (defined in the /etc/centreon-gorgone/config.d/cron.d/42-anomalydetection.yaml file).
It is possible to launch the first calculation manually via the following command from the central Centreon server:
su - centreon
perl /usr/share/centreon/bin/anomaly_detection --seasonality
View the anomalies detected
Once you have created an Anomaly Detection service, you can see it in the following places:
- The Monitoring > Resources Status menu.
- The Monitoring > Status Details > Services menu.
- The Monitoring > Performances > Graphs menu.
- The Monitoring > Event Logs > Event Logs menu.
- The service-monitoring widget in the Home > Custom Views menu.
- And all menus where you can operate on services.
Forward history of data
Sending data history is a very CPU intensive process. Depending on the number of services monitored, the extraction of data from the centreon_storage database can take several tens of minutes. This will strongly impact the performance of the database and may slow down the monitoring platform as a whole.
To be able to send data from an Anomaly Detection service, a first check must have been made. You can run a check on the service from the Resources Status page.
To send the history of data of an anomaly service to our SaaS platform, connect to your Centreon Central server and access the centreon user:
su - centreon
Select the anomaly service using the following command:
/usr/share/centreon/bin/anomaly_detection --list-services
You will see the list of services with their ID:
List of available anomaly detection services:

- id: 14, hostname: fw-beijing, servicename: anomaly-nbr-connect, metric name: connection
- id: 15, hostname: fw-brasilia, servicename: anomaly-nbr-connect, metric name: connection
- id: 17, hostname: fw-mexico, servicename: anomaly-nbr-connect, metric name: connection
- id: 18, hostname: fw-berlin, servicename: anomaly-nbr-connect, metric name: connection
- id: 22, hostname: fw-brasilia, servicename: anomaly-traffic-in, metric name: traffic_in
To send the history of data for the anomaly service with ID 14 for the last 4 weeks, execute the following command:
/usr/share/centreon/bin/anomaly_detection --send-history 14 --history-period 4w
Wait until the end of the process:
Sending data from 2020-03-09T09:32:31 to 2020-03-10T00:00:00
Sending data from 2020-03-10T00:00:00 to 2020-03-11T00:00:00
Sending data from 2020-03-11T00:00:00 to 2020-03-12T00:00:00
Sending data from 2020-03-12T00:00:00 to 2020-03-13T00:00:00
Sending data from 2020-03-13T00:00:00 to 2020-03-14T00:00:00
Sending data from 2020-03-14T00:00:00 to 2020-03-15T00:00:00
Sending data from 2020-03-15T00:00:00 to 2020-03-16T00:00:00
Sending data from 2020-03-16T00:00:00 to 2020-03-17T00:00:00
Sending data from 2020-03-17T00:00:00 to 2020-03-18T00:00:00
Sending data from 2020-03-18T00:00:00 to 2020-03-19T00:00:00
Sending data from 2020-03-19T00:00:00 to 2020-03-20T00:00:00
Sending data from 2020-03-20T00:00:00 to 2020-03-21T00:00:00
Sending data from 2020-03-21T00:00:00 to 2020-03-22T00:00:00
Sending data from 2020-03-22T00:00:00 to 2020-03-23T00:00:00
Sending data from 2020-03-23T00:00:00 to 2020-03-24T00:00:00
Sending data from 2020-03-24T00:00:00 to 2020-03-25T00:00:00
Sending data from 2020-03-25T00:00:00 to 2020-03-26T00:00:00
Sending data from 2020-03-26T00:00:00 to 2020-03-27T00:00:00
Sending data from 2020-03-27T00:00:00 to 2020-03-28T00:00:00
Sending data from 2020-03-28T00:00:00 to 2020-03-29T00:00:00
Sending data from 2020-03-29T00:00:00 to 2020-03-30T00:00:00
Sending data from 2020-03-30T00:00:00 to 2020-03-31T00:00:00
Sending data from 2020-03-31T00:00:00 to 2020-04-01T00:00:00
Sending data from 2020-04-01T00:00:00 to 2020-04-02T00:00:00
Sending data from 2020-04-02T00:00:00 to 2020-04-03T00:00:00
Sending data from 2020-04-03T00:00:00 to 2020-04-04T00:00:00
Sending data from 2020-04-04T00:00:00 to 2020-04-05T00:00:00
Sending data from 2020-04-05T00:00:00 to 2020-04-06T00:00:00
FAQ
What services are offered and their associated SLA?
The anomaly detection service is currently in closed beta test phase as described in the Centreon documentation. The purpose of this phase is to test our algorithms and their resulting predictions (floating thresholds). During this phase, Centreon will improve the anomaly detection feature based on users' feedback. No SLA will be available during this phase.
How long is the data stored?
The data is kept for the entire validity of the license. It will make it possible to recalculate models if necessary. An additional period of 3 months will be added at the end of the validity of the license before its deletion.
What data is hosted by the service?
The data hosted by the anomaly detection service only concerns data linked to the services created by the user. It includes the date and time of the control, the identifier of the monitored resource, the identifier of the associated indicator, the name of the performance data on which the computations will be performed as well as the value of the performance data.
How is the sending and storage of my data protected?
Sending data to our Cloud infrastructure is risk-free. Data is sent using end-to-end encryption. Collected data consists only in metrics and some Centreon identifiers (host name, service name). Our environment is protected by AWS Web Application Firewall and AWS Shields to prevent DDoS attacks. Our architecture has been reviewed by AWS architects (AWS Foundational Technical Review) and we are an AWS Qualified Partner.
What is the data used for?
The data is used to compute behavior models. From these models will be generated predictions used as floating thresholds by the Centreon platform.
Who has access to the data hosted by the service?
The data is associated with the access token of the anomaly detection offer. They are hosted on the Centreon SaaS Platform and partitioned by platform. Users with a token can only access their own data.
How can I request the deletion of data?
The deletion of data may be requested at any time. However, the history of the data is used to create a model to calculate the floating thresholds. Therefore participation in the program or subscription to the subsequent offer will be impossible. A request must be made via the Centreon professional support interface.